Kubernetes is an open-source container-orchestration system for automating computer application deployment, scaling and management. K8s has minimal production systems such as Microk8s that enables one to deploy Kubernetes clusters locally. In this article, we are focusing on how to deploy K8s clusters locally on Rocky Linux8 and AlmaLinux 8 with Microk8s.
Microk8s is a CNF Certified Upstream Kubernetes Deployment that runs on edge devices such as office desktops or local servers. Is a single-package lightweight Kubernetes that works on Windows, Mac and Linux. With Microk8s, you can get up your Kubernetes running within a minute. Being a snap, Microk8s run Kubernetes services natively while packing a set of libraries binaries needed.
Features of Microk8s
- Small – This meets developers need to for K8s for laptops and workstation development.
- Current – Gets track of upstream release latest K8s thus staying updated.
- Security – Frequent updates keeps the system secure by keeping it upto date.
- Simple – Minimizes administration and operations with an single-package install that has no moving parts for for smplicity and certainty.
- Comprehessive – Consists of collection of K8s capabilities and services; Auto-updates, service mesh, serverless, monitoring (Fluentd, Prometheus, Grafana, Metrics ),Ingress, Dashboards, Clustring and many more.
Microk8s Terms
- Pod – A collection of one or more containers that share storage and network resources.
- Container – These are building blocks for creating applications.
- Service – This is an abstraction that initiates the communication between different pods seamlessly.
- Master – Coordinates and controls the worker nodes.
- Node – Worker that runs pods.
- Kubectl – Command line client used in interacting with Kubernetes cluster.
- Snaps – App packages for desktop.
Set up MicroK8s Kubernetes on Rocky 8 / AlmaLinux 8
Follow the next steps to install MicroK8s Kubernetes Cluster on Rocky Linux 8 | AlmaLinux 8.
1. Install Snapd
Since Microk8s is a snap, we will need a snappy tool for us to install microk8s.
sudo dnf update -y
sudo dnf install epel-release
sudo dnf --enablerepo=epel -y install snapd
Create a symlink between “/var/lib/snapd/snap” and “/snap” to enable classic snap support.
sudo ln -s /var/lib/snapd/snap /snap
echo 'export PATH=$PATH:/var/lib/snapd/snap/bin' | sudo tee -a /etc/profile.d/snap.sh
source /etc/profile.d/snap.sh
Now enable snapd and snapd communication socket.
sudo systemctl enable --now snapd.socketTurn off Selinux or switch it to permissive mode.
sudo setenforce 0
sudo sed -i 's/^SELINUX=.*/SELINUX=permissive/g' /etc/selinux/config
2. Install Microk8s
Use the snap command to install Microk8s from the snappy repository.
$ sudo snap install microk8s --classic
2024-07-23T16:06:41Z INFO Waiting for automatic snapd restart...
microk8s (1.30/stable) v1.30.1 from Canonical✓ installed
Add user to Microk8s group and change the ownership of Kubernetes to your user.
sudo usermod -a -G microk8s $USER
sudo chown -f -R $USER ~/.kube
Logout and login again to apply the changes.
$ exitConfirm Microk8s status to ensure that is up and running.
$ microk8s kubectl get services
NAME         TYPE        CLUSTER-IP     EXTERNAL-IP   PORT(S)   AGE
kubernetes   ClusterIP   10.152.183.1   <none>        443/TCP   4m6s
Run this command to see Mikrok8s configs.
microk8s configShow available nodes in Microk8s.
microk8s kubectl get nodes3. Deployment of Pods With Microk8s
A pod is a representation of a single running process in a cluster and can contain one or more containers such as docker. We are going to deploy an apache pod which is one of the commonly used webservers.
$ microk8s kubectl create deployment test-apache --image=httpd
deployment.apps/test-apache created
Run this command to see available pods plus one we have just deployed.
$ microk8s kubectl get pods
NAME                           READY   STATUS    RESTARTS   AGE
test-apache-5848c9f9d7-7vvqb   1/1     Running   0          66s
Show environmental variables for httpd pod.
$ microk8s kubectl exec test-apache-5848c9f9d7-7vvqb -- envYou access the pod via ssh as shown below.
$ microk8s kubectl exec -it test-apache-5848c9f9d7-7vvqb -- bash
$ root@test-apache-5848c9f9d7-7vvqb:/usr/local/apache2# ls
bin  build  cgi-bin  conf  error  htdocs  icons  include  logs  modules
$ root@test-apache-5848c9f9d7-7vvqb:/usr/local/apache2# hostname
test-apache-5848c9f9d7-7vvqb
$ root@test-apache-5848c9f9d7-7vvqb:/usr/local/apache2# exit
4. Scaling out pods
Scaling is simple the process of creating replicates of applications/deployments to enhance High Availability. With this feature, Kubernetes is able to handle as many requests as possible with low latencies. Use the command below to create replicas of the pod we have just deployed.
$ microk8s kubectl scale deployment test-apache --replicas=4
deployment.apps/test-apache scaled
Now view all replicated pods.
$ microk8s kubectl get pods
NAME                           READY   STATUS    RESTARTS   AGE
test-apache-5848c9f9d7-7vvqb   1/1     Running   0          17m
test-apache-5848c9f9d7-77j8j   1/1     Running   0          57s
test-apache-5848c9f9d7-jtr6l   1/1     Running   0          56s
test-apache-5848c9f9d7-vwrvl   1/1     Running   0          56s
Expose Apache service to network for accessibility.
$ microk8s kubectl expose deployment test-apache --type="NodePort" --port 80
service/test-apache exposed

$ microk8s kubectl get services test-apache
NAME          TYPE       CLUSTER-IP       EXTERNAL-IP   PORT(S)        AGE
test-apache   NodePort   10.152.183.184   <none>        80:31827/TCP   107s
Verify service accessibility.
$ curl 10.152.183.184
<html><body><h1>It works!</h1></body></html>

# With Host IP and Node Port
$ curl http://172.10.10.194:31353
<html><body><h1>It works!</h1></body></html>
5. Adding Nodes to Master Microk8s Cluster
You can run pods on one cluster but to improve performance by creating high availability you can add nodes to the master node. This helps for central management of pods; with the master, you have full control over other nodes.
On the new Rocky Server (Node), repeat step 1 and step two then run commands below.
$ export OPENSSL_CONF=/var/lib/snapd/snap/microk8s/current/etc/ssl/openssl.cnf
# Allow ports in firewall
sudo firewall-cmd --add-port={25000/tcp,10250/tcp,10255/tcp} --permanent
sudo firewall-cmd --reload
On the master node, open ports in the firewall and generate a joining command.
sudo firewall-cmd --add-port={25000/tcp,16443/tcp,12379/tcp,10250/tcp,10255/tcp,10257/tcp,10259/tcp} --permanent
sudo firewall-cmd --reload

#Generate joining command
$ microk8s add-node
From the node you wish to join to this cluster, run the following:
microk8s join 172.4.31.4:25000/21256a37c0760b356c16f429e78b118a/6560ab66ba43

If the node you are adding is not reachable through the default interface you can use one of the following:
 microk8s join 172.4.31.4:25000/21256a37c0760b356c16f429e78b118a/6560ab66ba43
Now on the new node run the joining command. Make sure the two nodes can communicate before running this command.
$ microk8s join 172.4.31.4:25000/21256a37c0760b356c16f429e78b118a/6560ab66ba43
Contacting cluster at 172.4.31.4
Waiting for this node to finish joining the cluster. .. .. .. .. .. .. .. .. .. ..
Now run this command on the master to see added node.
microk8s kubectl get nodes6. Enabling Dashboard
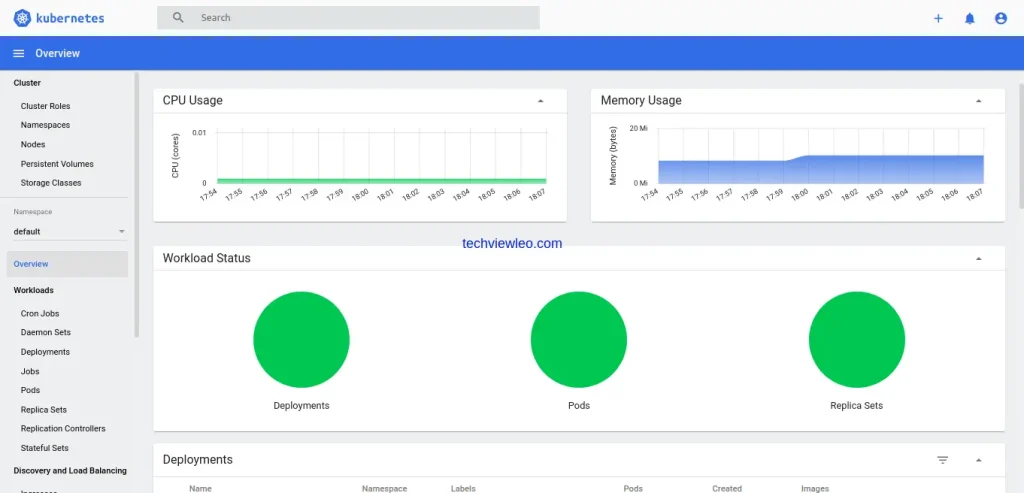
The dashboard gives a visualization of nodes, pods, metrics and processes that are happening with a cluster. This is a web-based Kubernetes dashboard. Since it is an addon in Microk8s, we are just going to enable it.
$ microk8s enable dashboard dns
Enabling Kubernetes Dashboard
Enabling Metrics-Server
clusterrole.rbac.authorization.k8s.io/system:aggregated-metrics-reader created
clusterrolebinding.rbac.authorization.k8s.io/metrics-server:system:auth-delegator created
====================================================================================================================================================================================================
rolebinding.rbac.authorization.k8s.io/kubernetes-dashboard created
clusterrolebinding.rbac.authorization.k8s.io/kubernetes-dashboard created
deployment.apps/kubernetes-dashboard created
service/dashboard-metrics-scraper created
deployment.apps/dashboard-metrics-scraper created
Confirm if the dashboard is up and running.
$ microk8s kubectl get services -n kube-system
NAME                        TYPE        CLUSTER-IP       EXTERNAL-IP   PORT(S)                  AGE
metrics-server              ClusterIP   10.152.183.58    <none>        443/TCP                  74s
kubernetes-dashboard        ClusterIP   10.152.183.111   <none>        443/TCP                  32s
dashboard-metrics-scraper   ClusterIP   10.152.183.117   <none>        8000/TCP                 31s
kube-dns                    ClusterIP   10.152.183.10    <none>        53/UDP,53/TCP,9153/TCP   30s
If RBAC is not enabled access the dashboard using the default token retrieved with:
$ microk8s kubectl -n kube-system describe secret $(microk8s kubectl -n kube-system get secret |           grep default-token | awk '{print $1}')
Name:         default-token-dsvjr
Namespace:    kube-system
Labels:       <none>
Annotations:  kubernetes.io/service-account.name: default
              kubernetes.io/service-account.uid: cc8c7045-f2dd-414f-a19c-36d219aa78ef
Type:  kubernetes.io/service-account-token
Data
====
namespace:  11 bytes
token:      eyJhbGciOiJSUzI1NiIsImtpZCI6IlRsVXRGSEdyNnM2bUN3dFV3VFpURDlFaE1FNGx……..
ca.crt:     1123 bytes
Copy the generated token and save it somewhere since you will need it during we login to the dashboard.
To access the dashboard, you will need to forward the port on which dashboard is running locally one of the free ports on your host. Use adree 0.0.0.0 to allow access from any IP.
microk8s kubectl port-forward -n kube-system service/kubernetes-dashboard --address 0.0.0.0 1001:443Now you can access the dashboard via port 1001. In case you have a firewall running make sure you have the port enabled first.
sudo firewall-cmd --permanent --add-port=30560/tcp
sudo firewall-cmd --reload
Now open your browser then enter your server_IP/FQDN followed by port 1001 to login to the dashboard. Should look like; https://[Server_IP/FQDN]:1001. The login page below will appear on your screen.
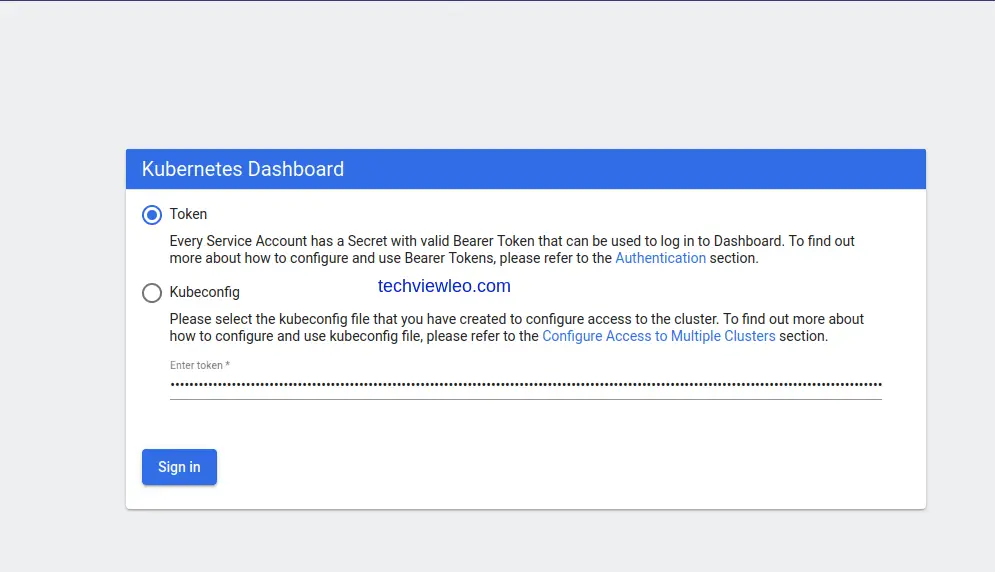
Since we have the token key generated, choose the Token option and paste the token to proceed. If the token is expired then you can regenerate a new one to use.
Upon successful login, you should be able to land here.
7. Enable built-in storage on Master
Microk8s comes with built-in storage that can be used by deployments. This storage needs to be activated/enabled to make it available for a pod. Enable storage by computing these commands on the master node.
$ export LD_LIBRARY_PATH="$LD_LIBRARY_PATH:/lib64"
$ microk8s enable storage
Enabling default storage class
deployment.apps/hostpath-provisioner created
storageclass.storage.k8s.io/microk8s-hostpath created
serviceaccount/microk8s-hostpath created
clusterrole.rbac.authorization.k8s.io/microk8s-hostpath created
clusterrolebinding.rbac.authorization.k8s.io/microk8s-hostpath created
Storage will be available soon
Confirm if hostpath provisioner pod has been created. This shows that storage is now enabled.
$ microk8s kubectl -n kube-system get pods
NAME                                         READY   STATUS    RESTARTS   AGE
metrics-server-8bbfb4bdb-swbx4               1/1     Running   0          46m
calico-node-jlw44                            1/1     Running   0          65m
calico-kube-controllers-f7868dd95-pmpwl      1/1     Running   0          65m
kubernetes-dashboard-85fd7f45cb-zjwbk        1/1     Running   0          43m
coredns-7f9c69c78c-v67cq                     1/1     Running   0          43m
dashboard-metrics-scraper-78d7698477-fkvk9   1/1     Running   0          43m
hostpath-provisioner-5c65fbdb4f-m8xns        1/1     Running   0          87s
Confirm StorageClass created. This is very important since we will need it when creating Persistent Volumes.
$ microk8s kubectl get storageclasses
NAME                          PROVISIONER            RECLAIMPOLICY   VOLUMEBINDINGMODE   ALLOWVOLUMEEXPANSION   AGE
microk8s-hostpath (default)   microk8s.io/hostpath   Delete          Immediate           false                  65s
From above, we can confirm StorageClass called microk8s-hostpath is created.
8. Creating Persistent Volume Claim
At this point, am going to show you how to create PersistentVolumeClaim from StorageClass we just created in the previous step. Open your editor and paste this command to create your first PVC YAML file..
$ vi my-pvc.yml
apiVersion: v1
kind: PersistentVolumeClaim
metadata:
  # any PVC name
  name: sample-pvc
spec:
  accessModes:
    - ReadWriteOnce
  # specify StorageClass
  storageClassName: microk8s-hostpath
  resources:
    requests:
      # storage size to use
      storage: 30Gi
Use create command to bring up a new PVC we initialized above.
$ microk8s kubectl create -f my-pvc.yml
persistentvolumeclaim/my-pvc created
Confirm that your first PVC is created now.
$ microk8s kubectl get pv
NAME                                       CAPACITY   ACCESS MODES   RECLAIM POLICY   STATUS   CLAIM            STORAGECLASS        REASON   AGE

pvc-1a367fbb-014b-4f0d-bffe-ef44445ce80f   30Gi       RWO            Delete           Bound    default/my-pvc   microk8s-hostpath            27s


$ microk8s kubectl get pvc
NAME     STATUS   VOLUME                                     CAPACITY   ACCESS MODES   STORAGECLASS        AGE
my-pvc   Bound    pvc-1a367fbb-014b-4f0d-bffe-ef44445ce80f   30Gi       RWO            microk8s-hostpath   67s
9. Enabling and Configuring Registry
Kubernetes comes with internal storage that can be used for storing making images such as docker images locally. Registry comes as an addon and needs to be enabled for it to be functional. By default, the registry has a storage capacity of 20Gi. If you would like to have your registry with a different volume size the make sure you specify the size at the end of your command as illustrated below.
$ microk8s enable registry:size=20Gi
Addon storage is already enabled.
Enabling the private registry
Applying registry manifest
namespace/container-registry created
persistentvolumeclaim/registry-claim created
deployment.apps/registry created
service/registry created
configmap/local-registry-hosting configured
The registry is enabled
The size of the persistent volume is 20Gi
Confirm that registry is created and running.
$ microk8s kubectl get pods -A
NAMESPACE            NAME                                         READY   STATUS    RESTARTS   AGE
default              test-apache-5848c9f9d7-zng85                 1/1     Running   0          85m
kube-system          metrics-server-8bbfb4bdb-swbx4               1/1     Running   0          74m
kube-system          calico-node-jlw44                            1/1     Running   0          93m
kube-system          calico-kube-controllers-f7868dd95-pmpwl      1/1     Running   0          93m
kube-system          kubernetes-dashboard-85fd7f45cb-zjwbk        1/1     Running   0          72m
kube-system          coredns-7f9c69c78c-v67cq                     1/1     Running   0          72m
kube-system          dashboard-metrics-scraper-78d7698477-fkvk9   1/1     Running   0          72m
kube-system          hostpath-provisioner-5c65fbdb4f-m8xns        1/1     Running   0          29m
container-registry   registry-9b57d9df8-zz2pn                     1/1     Running   0          7m5s
To test if our registry is functional, pull an image from docker then push it to the local registry. From here, we will try to pull images from the local registry from the worker node.
$ sudo dnf install podman -y
$ podman pull redis
✔ docker.io/library/redis:latest
Trying to pull docker.io/library/redis:latest...
Check if the image is now pulled and available locally.
$ podman images
REPOSITORY               TAG     IMAGE ID      CREATED      SIZE
docker.io/library/redis  latest  aa4d65e670d6  2 weeks ago  109 MB
Edit your podman registry configuration file by adding cluster IP so that registry can be accessed by other nodes.
$ sudo vi /etc/containers/registries.conf
# Around line 48 : add your [insecure registry]
[registries.insecure]
registries = ['localhost', '127.0.0.1', '172.4.31.4']
Tag the image by giving it a name that can be identified locally then push the image to the registry.
$ podman tag aa4d65e670d6 172.4.31.4:32000/test-redis:techviewleo
$ podman push 192.168.95.59:32000/test-redis:techviewleo
Getting image source signatures
Copying blob 45f6df634253 done
Copying blob 262de04acb7e done
Copying blob e46136075591 done
Copying blob dd1ebb1f5319 done
Copying blob 11f991845040 done
Copying blob 814bff734324 done
Copying config aa4d65e670 done
Writing manifest to image destination
Storing signatures
Run podman images command to confirm the changes.
$ podman images
REPOSITORY                  TAG           IMAGE ID      CREATED      SIZE
docker.io/library/redis     latest        aa4d65e670d6  2 weeks ago  109 MB
172.4.31.4:32000/test-redis  techviewleo  aa4d65e670d6  2 weeks ago  109 MB
Fro the above, you will note that we have two images; one from docker.io and one from our local registry.
To do further to our registry if it is working, login to your worker node and pull the Redis image in the local registry.
Install podman on a worker node.
sudo dnf install -y podmanEdit podman configuration file by adding local registry under [registries.insecure] since we will not require and certificate for secure access.
$ sudo vi /etc/containers/registries.conf
# Around line 48 : add your [insecure registry]
[registries.insecure]
registries = ['127.0.0.1', '172.4.31.4']
Now try to pull images from the local registry.
$ podman pull 172.4.31.4:32000/test-redis:techviewleo
Trying to pull 172.26.16.92:32000/test-redis:techviewleo...
Getting image source signatures
Copying blob 353f6df645263 done
Copying blob 262de04ade5e done
Copying blob e46136897451 done
Copying blob dd1ebb1f4564 done
Copying blob 11f991849035 done
Copying blob 814bff342752 done
Copying config aa4d64f562 done
Writing manifest to image destination
Storing signatures
10. Enable Logging With Prometheus
Microk8s also is packed with Prometheus as an internal add-on that needs to be enabled as well. It is an amazing metrics tracking tool that comes with Grafana for visualization in graph format. Go ahead and enable Prometheus as shown below.
$ microk8s enable prometheus
Enabling Prometheus
namespace/monitoring created
customresourcedefinition.apiextensions.k8s.io/alertmanagerconfigs.monitoring.coreos.com created
……………………………………………………………………………………………………………………………………………………………………………………………………………………………….
The Prometheus operator is enabled (user/pass: admin/admin)
Addon dashboard is already enabled.
Addon dns is already enabled.
Confirm Prometheus and other monitoring pods deployed.
$ microk8s kubectl get pods -n monitoring
NAME                                   READY   STATUS    RESTARTS   AGE
prometheus-adapter-69b8496df6-jjd4j    1/1     Running   0          3m59s
node-exporter-rdgb5                    2/2     Running   0          4m
kube-state-metrics-78dc55b74b-87xcn    3/3     Running   0          3m59s
prometheus-operator-7649c7454f-dk855   2/2     Running   0          3m59s
grafana-6b8df57c5b-np6d6               1/1     Running   0          3m59s
alertmanager-main-0                    2/2     Running   0          3m14s
prometheus-k8s-0                       2/2     Running   1          3m13s
11. Accessing Prometheus and Grafana
Since Prometheus is running on the internal network, we have to forward service to the available ports to enable eternal access. To achieve this, get the services using monitoring as namespace since this was namespace it was deployed with.
$ microk8s kubectl get services -n monitoring
NAME                    TYPE        CLUSTER-IP       EXTERNAL-IP   PORT(S)                      AGE
prometheus-operator     ClusterIP   None             <none>        8443/TCP                     2m58s
alertmanager-main       ClusterIP   10.152.183.112   <none>        9093/TCP                     2m51s
grafana                 ClusterIP   10.152.183.113   <none>        3000/TCP                     2m50s
kube-state-metrics      ClusterIP   None             <none>        8443/TCP,9443/TCP            2m50s
node-exporter           ClusterIP   None             <none>        9100/TCP                     2m49s
prometheus-adapter      ClusterIP   10.152.183.86    <none>        443/TCP                      2m49s
prometheus-k8s          ClusterIP   10.152.183.139   <none>        9090/TCP                     2m49s
alertmanager-operated   ClusterIP   None             <none>        9093/TCP,9094/TCP,9094/UDP   78s
prometheus-operated     ClusterIP   None             <none>        9090/TCP                     78s
Make sure that the ports where Prometheus and Grafana are running are exposed on the firewall.
sudo firewall-cmd --add-port={9090,3000}/tcp --permanent
sudo firewall-cmd --reload
Now port forward to access service on the web browser. Consider running the command in screen mode should you need to perform other tasks while the dashboard is still running.
$ microk8s kubectl port-forward -n monitoring service/prometheus-k8s --address 0.0.0.0 9090:9090
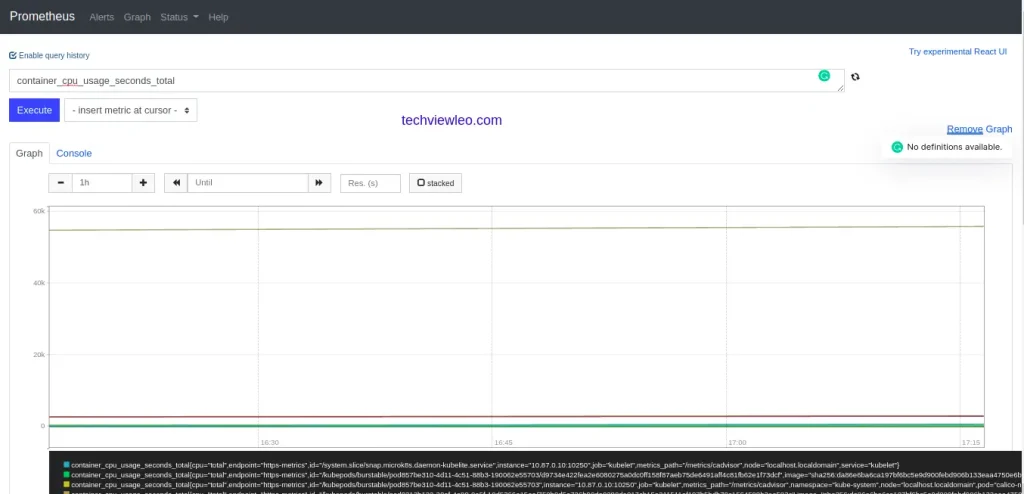
Forwarding from 0.0.0.0:9090 -> 9090Open server_IP/FQDN in the browser and point it to port 9090 to access Prometheus.
HTTP://[Server_IP/FQDN]:9090
Similarly, to access Grafana also port forward services to port 3000.
$ microk8s kubectl port-forward -n monitoring service/prometheus-k8s --address 0.0.0.0 9090:9090
Forwarding from 0.0.0.0:9090 -> 3000
Visit your browser with your IP/FQDN and point it to port 3000. You will be presented with the login page as shown below. Use default logins admin for username and also admin for the password.
HTTP://[Server_IP/FQDN]:3000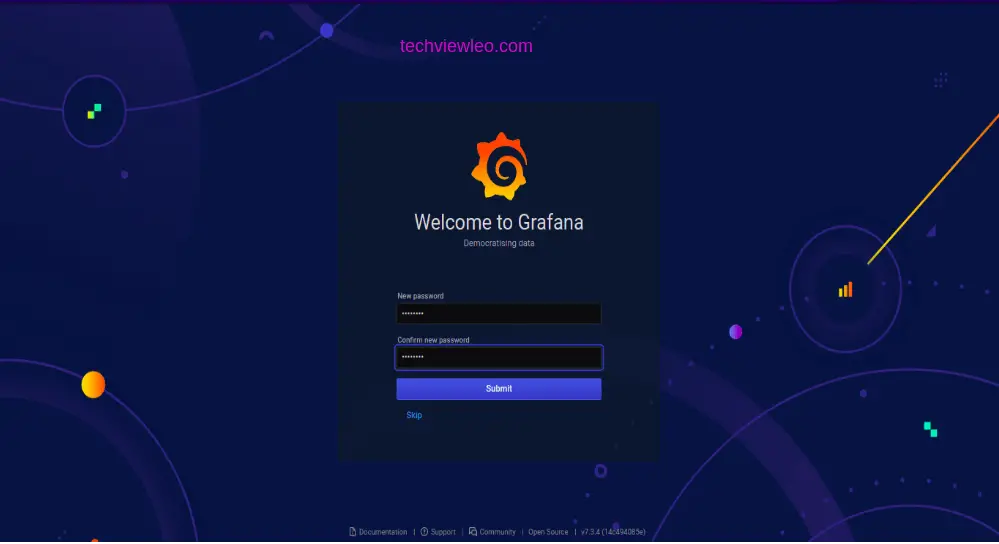
Change password to the most preferred one.

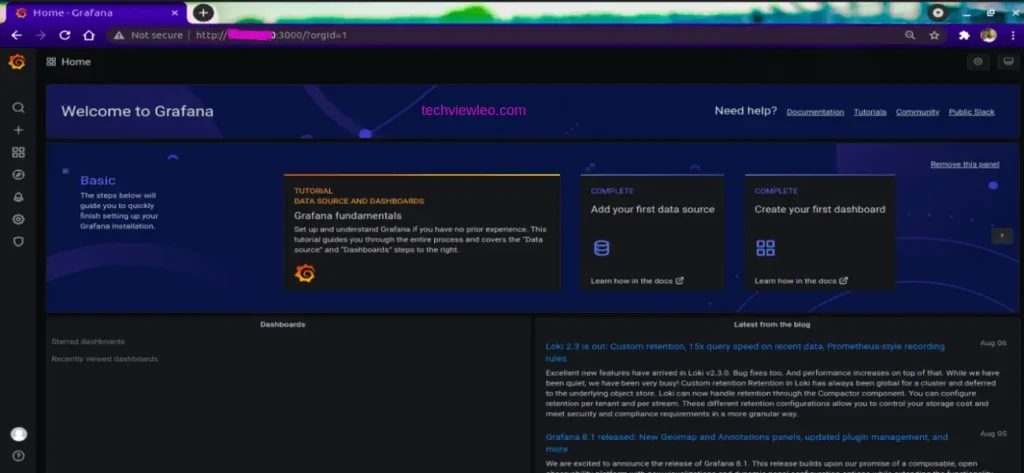
On login, you should now be redirected to a page that is similar to this one.
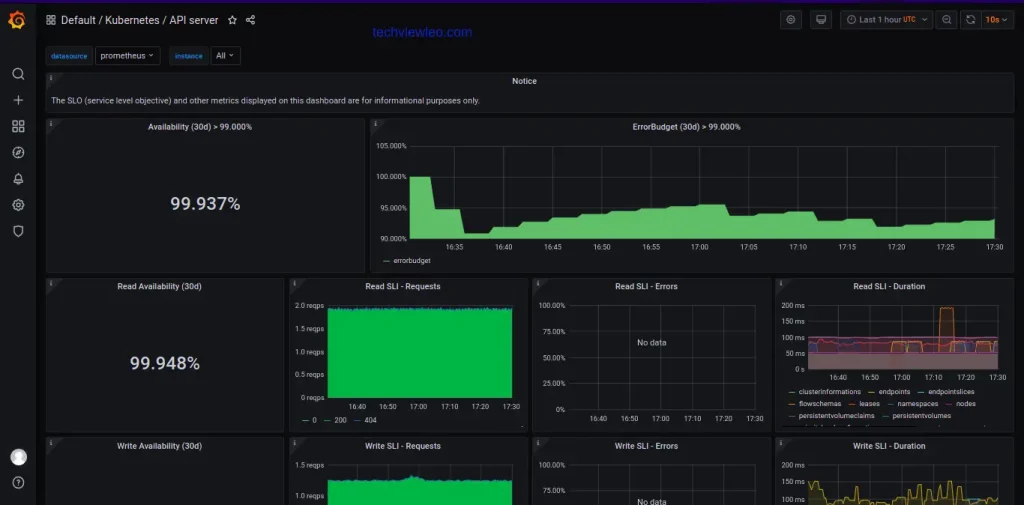
Navigate to the dashboard area to see available sample graphs already created.
Conclusion
Kubernetes is now mostly being adopted in developing cloud infrastructures for its scalability, central management and many more features that any user would expect from any cloud provider. We have covered how you can install and deploy the Microk8s cluster locally on Rocky 8 and how you can worker nodes on this cluster. Furthermore, you should also be in a position to enable and use add-ons such as registry, Grafana, Storage and many more in Microk8s.
CloudSpinx is ready to help out with container related projects don’t hesitate to contact us.