Filebeat uses a backpressure-sensitive protocol to send data to Logstash or Elastic search account. Logstash is a data processing tool that collects and transforms logs incoming from Filebeat. Kibana provides visualization of data logs in either charts or graphs. Elasticseach is an open source full-text search engine that stores incoming logs from Logstash and offers the ability to search the logs in real time. The combination of these tools make up an Elastic stack (ELK stack).
In this Guide, we will install and Use Filebeat, Logstash and Kibana on Rocky / AlmaLinux. In this guide, we will use two machines:
| Host Name | Os | IP_Address | Purpose |
| rockylinux8 | Rocky Linux 8 | 192.168.1.15 | Filebeat(Client Machine) |
| node-01 | AlmaLinux 8 | 192.168.1.49 | Elasticsearch, Logstash and Kibana(ELK stack) |
We will need to have the Java installed will use Java OpenJDK.
sudo dnf install java-17-openjdk-develCheck Java installed version.
$ java -version
openjdk version "17.0.11" 2024-04-16 LTS
OpenJDK Runtime Environment (Red_Hat-17.0.11.0.9-3) (build 17.0.11+9-LTS)
OpenJDK 64-Bit Server VM (Red_Hat-17.0.11.0.9-3) (build 17.0.11+9-LTS, mixed mode, sharing)
Step 1: Install Elasticsearch
If you’re interested in Cluster setup of Elasticsearch refer to the guide below:
Import Elastic GPG key used in signing the packages:
sudo rpm --import https://artifacts.elastic.co/GPG-KEY-elasticsearchSetup a YUM repository for Elasticsearch as below:
sudo vi /etc/yum.repos.d/elastic.repoIn the file paste below data:
- Elasticsearch 7.x
[elasticsearch-7.x]
name=Elasticsearch repository for 7.x packages
baseurl=https://artifacts.elastic.co/packages/7.x/yum
gpgcheck=1
gpgkey=https://artifacts.elastic.co/GPG-KEY-elasticsearch
enabled=1
autorefresh=1
type=rpm-md
Then install Elasticsearch from the repository.
sudo dnf install elasticsearchDependencies resolved:
...
Transaction Summary
==========================================================================
Install  1 Package

Total download size: 312 M
Installed size: 520 M
Is this ok [y/N]: y
Configure Elasticsearch.
sudo vi /etc/elasticsearch/elasticsearch.ymlSet the node.name and cluster.name, by finding these lines and uncomment them then edit them as below.
cluster.name: el-cluster
     node.name: node-1
     path.data: /var/lib/elasticsearch
     network.host: 0.0.0.0
........
#cluster.initial_master_nodes: ["node-1", "node-2"]
# Single Node Discovery
discovery.type: single-node
Start and enable Elasticsearch service
sudo systemctl daemon-reload
sudo systemctl enable elasticsearch
sudo systemctl start elasticsearch
Check the status of elasticsearch.
$ systemctl status elasticsearch
● elasticsearch.service - Elasticsearch
   Loaded: loaded (/usr/lib/systemd/system/elasticsearch.service; enabled; vendor preset: disabled)
   Active: active (running) since Wed 2024-07-17 10:22:00 UTC; 13min ago
     Docs: https://www.elastic.co
 Main PID: 1379 (java)
    Tasks: 63 (limit: 48750)
   Memory: 4.3G
   CGroup: /system.slice/elasticsearch.service
           ├─1379 /usr/share/elasticsearch/jdk/bin/java -Xshare:auto -Des.networkaddress.cache.ttl=60 -Des.networkaddress.cache.negative.ttl=10 -XX:+AlwaysPreTouch -Xss1m -Djava.awt.headless=true ->
           └─2034 /usr/share/elasticsearch/modules/x-pack-ml/platform/linux-x86_64/bin/controller

Jul 17 10:21:40 rocky8.cloudspinx.com systemd[1]: Starting Elasticsearch...
Jul 17 10:21:45 rocky8.cloudspinx.com systemd-entrypoint[1379]: Jul 17, 2024 10:21:45 AM sun.util.locale.provider.LocaleProviderAdapter <clinit>
Jul 17 10:21:45 rocky8.cloudspinx.com systemd-entrypoint[1379]: WARNING: COMPAT locale provider will be removed in a future release
Jul 17 10:22:00 rocky8.cloudspinx.com systemd[1]: Started Elasticsearch.
Test if elasticsearch is responding to queries:
curl -X GET http://127.0.0.1:9200Sample output:
{
  "name" : "node-1",
  "cluster_name" : "el-cluster",
  "cluster_uuid" : "_p4X54ffQaGSFVy8aTrOxg",
  "version" : {
    "number" : "7.17.22",
    "build_flavor" : "default",
    "build_type" : "rpm",
    "build_hash" : "38e9ca2e81304a821c50862dafab089ca863944b",
    "build_date" : "2024-06-06T07:35:17.876121680Z",
    "build_snapshot" : false,
    "lucene_version" : "8.11.3",
    "minimum_wire_compatibility_version" : "6.8.0",
    "minimum_index_compatibility_version" : "6.0.0-beta1"
  },
  "tagline" : "You Know, for Search"
}
Step 2: Install Logstash
We need to install Logstash to collect logs from Elasticsearch.
sudo dnf -y install logstashLogstash config file is stored in /etc/logstash/conf.d/. It has 3 sections i.e the input, filter and the output. All the 3 sections can exist in one or different files
Lets use a single file for the 3 sections:
sudo vi /etc/logstash/conf.d/beats.confLet us configure Logstash to listen on port 5044 for incoming logs from Filebeats installed on the client machine
input {
  beats {
    port => 5044
  }
}
The filter will be used to monitor syslog, by looking for the logs labelled syslog and parse them
filter {
  if [type] == "syslog" {
     grok {
        match => { "message" => "%{SYSLOGLINE}" }
  }
     date {
        match => [ "timestamp", "MMM  d HH:mm:ss", "MMM dd HH:mm:ss" ]
     }
  }
}
The output section defines the section where the logs will be stored. It will store them on the Elastic node as below:
output {
  elasticsearch {
    hosts => ["192.168.1.49:9200"]
    index => "%{[@metadata][beat]}-%{+YYYY.MM.dd}"
  }
}
Start and enable Logstash:
sudo systemctl enable --now logstashConfirm if logstash is listening on port 5044 as set:
sudo netstat -antup | grep -i 5044Incase of troubles, check Logstash logs
cat /var/log/logstash/logstash-plain.logStep 3: Install Kibana
Kibana is the visualization tool for Elasticsearch. Install it by running the commands below:
sudo dnf -y install kibanaConfigure Kibana as below:
sudo vi /etc/kibana/kibana.ymlVerify the status if data has been collected normally:
# line 7 : uncomment and change (listen all)
server.host: "0.0.0.0"
# line 29 : uncomment and change (specify own hostname)
server.name: "rockylinux8"
# line 32 : uncomment and change if you need
# set if elasticsearch and Kibana are running on different Host
elasticsearch.hosts: ["http://192.168.1.49:9200"]
Start and enable Kibana
sudo systemctl enable --now kibanaAllow service ports through the firewall. Port 5044 Logstash to receive logs, port 5601 allows one access Kibana from external servers.
sudo firewall-cmd --add-port={5601,5044}/tcp --permanent
sudo firewall-cmd --reload
Step 4: Install and Configure Filebeat
There are four beats clients, Metricbeats, Topbeat, Packetbeat and Filebeat. In this Guide, we go for Filebeat which is a real-time insight into log data.
sudo dnf -y install filebeatFilebeat config is a YAML file. Here, indentation is key, ensure every space is considered and placed appropriately.
sudo vi /etc/filebeat/filebeat.ymlIn the YAML file, make these changes, comment out output.elasticsearch.
#-------------------------- Elasticsearch output ------------------------------
#output.elasticsearch:
  # Array of hosts to connect to.
  #hosts: ["localhost:9200"]

  #protocol: "https"
 # Protocol - either `http` (default) or `https`.

  # Authentication credentials - either API key or username/password.
  #api_key: "id:api_key"
  #username: "elastic"
  #password: "changeme"
Still in the file, find output.logstash and modify as below.
#----------------------------- Logstash output --------------------------------
output.logstash:
  # The Logstash hosts
  hosts: ["192.168.1.49:5044"]
Then configure filebeat to send system logs to Logstash under paths as below:
filebeat.inputs:

# Each - is an input. Most options can be set at the input level, so
# you can use different inputs for various configurations.
# Below are the input specific configurations.

- type: log

  # Change to true to enable this input configuration.
  enabled: true

  # Paths that should be crawled and fetched. Glob based paths.
  paths:
    - /var/log/messages
    #- c:\programdata\elasticsearch\logs\*
sudo systemctl enable --now filebeatWith Kibana running, one can easily import data to dashboard.
Step 5: Access Kibana Web Interface
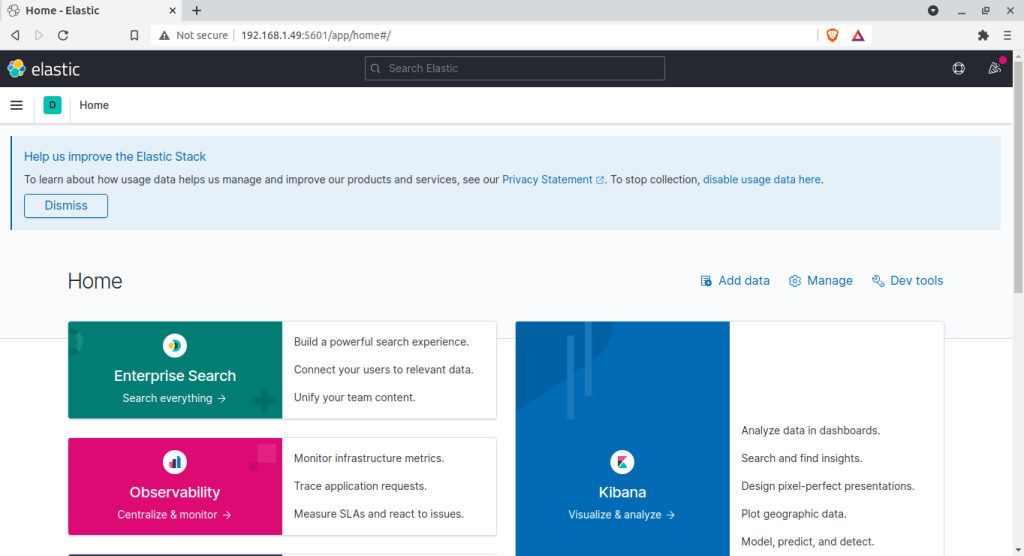
You can access Kibana with this URL http://IP_Address:5601/
You will see this page:

Enable Filebeat Modules
Now we need to enable Filebeat modules from the client machine. List the modules:
filebeat modules listThen proceed and enable the module example logstash, apache e.t.c
filebeat modules enable <module-name>Sample output:
$ sudo filebeat modules enable logstash
Enabled logstash
Setup the environment.
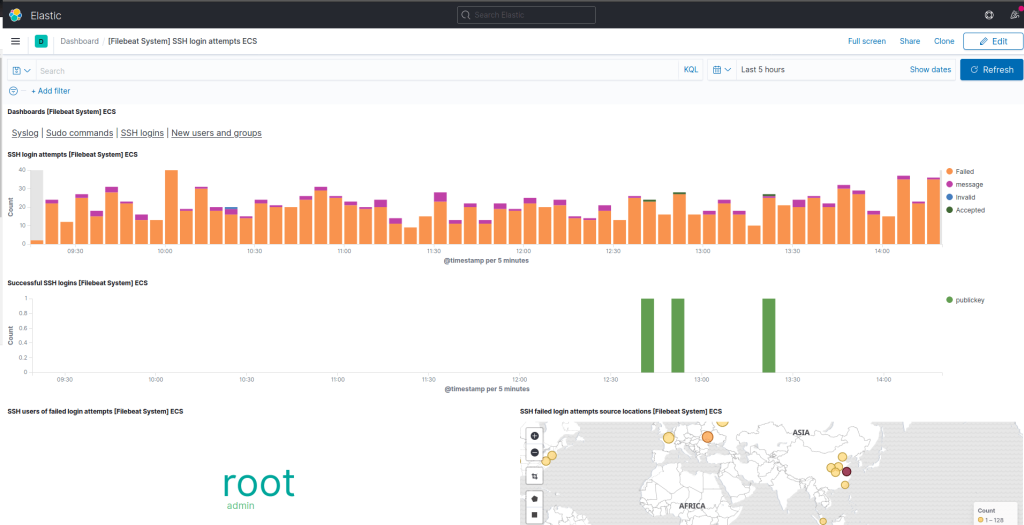
sudo filebeat setup -eNow with the module loaded, navigate to your dashboard and visualize data.

Conclusion
We have successfully installed and used Filebeat, Logstash and Kibana on Rocky / AlmaLinux Linux 8. We have walked through all the necessary configuration settings. I hope this article was helpful. 😁
Looking to streamline your tech stack? At CloudSpinx, we deliver consulting services and solutions to your IT ventures and needs.
Check out more of our guides:


