

Grafana is an open source platform for monitoring and observability. It allows you to visualize, query, alert on metrics stored in various storage backends. With Grafana you can create, explore, and share your visualization dashboards with your team, friends or open source community and foster a data driven culture. In this article we will show you how to install Grafana on Amazon Linux 2023 server.
In our recent article on monitoring we covered the installation and configuration of Prometheus monitoring tool on Amazon Linux. This guide is a continuation of our monitoring series. Some notable features of Grafana Monitoring platform are:
- Visualize: Fast and flexible client side graphs with a multitude of options. Panel plugins for many different way to visualize metrics and logs.
- Dynamic Dashboards: Create dynamic & reusable dashboards with template variables that appear as dropdowns at the top of the dashboard.
- Explore Metrics: Explore your data through ad-hoc queries and dynamic drilldown. Split view and compare different time ranges, queries and data sources side by side.
- Explore Logs: Experience the magic of switching from metrics to logs with preserved label filters. Quickly search through all your logs or streaming them live.
- Alerting: Visually define alert rules for your most important metrics. Grafana will continuously evaluate and send notifications to systems like Slack, PagerDuty, VictorOps, OpsGenie.
- Mixed Data Sources: Mix different data sources in the same graph! You can specify a data source on a per-query basis. This works for even custom datasources.
Install Grafana on Amazon Linux 2023
The steps used to install Grafana on Amazon Linux 2023 server are straightforward. You’ll add a YUM repository and pull the latest software packages from the repository using yum package manager. There are two editions of Grafana that can be installed on Amazon Linux 2023 server.
- Grafana
- Grafana Enterprise
Add Grafana YUM repository to Amazon Linux 2023
First, import the GPG key:
wget -q -O gpg.key https://rpm.grafana.com/gpg.key
sudo rpm --import gpg.key
Add a new file to your YUM repo using the method of your choice. I’ll use below single line commands to create a repository file in /etc/yum.repos.d/grafana.repo.
sudo tee /etc/yum.repos.d/grafana.repo > /dev/null <<'EOF'
[grafana]
name=grafana
baseurl=https://rpm.grafana.com
repo_gpgcheck=1
enabled=1
gpgcheck=1
gpgkey=https://rpm.grafana.com/gpg.key
sslverify=1
sslcacert=/etc/pki/tls/certs/ca-bundle.crt
EOF
Then update your repository cache:
sudo yum makecachef you run the yum repolist command, it should return output similar to below.
$ sudo yum repolist
repo id                                                                                        repo name
amazonlinux                                                                                    Amazon Linux 2023 repository
grafana                                                                                        grafana
kernel-livepatch                                                                               Amazon Linux 2023 Kernel Livepatch repository
Agree to retrieve repository GPG key.
Install Grafana on Amazon Linux 2023
With the repository created and confirmed to be working, proceed to install Grafana on Amazon Linux 2:
$ sudo yum install -y grafana
Last metadata expiration check: 13:22:44 ago on Thu Jan 15 00:01:45 2026.
Dependencies resolved.
==========================================================================================================================================================================================================================
 Package                                             Architecture                                       Version                                                 Repository                                           Size
==========================================================================================================================================================================================================================
Installing:
 grafana                                             x86_64                                             12.3.1-1                                                grafana                                             184 M

Transaction Summary
==========================================================================================================================================================================================================================
Install  1 Package

Total download size: 184 M
Installed size: 676 M
Is this ok [y/N]: y
Agreeto import GPG Key:
Importing GPG key 0x10458545:
 Userid     : "Grafana Labs <[email protected]>"
 Fingerprint: B53A E77B ADB6 30A6 8304 6005 963F A277 1045 8545
 From       : https://rpm.grafana.com/gpg.key
Is this ok [y/N]: y
Installed package details.
$ rpm -qi grafana
Name        : grafana
Version     : 12.3.1
Release     : 1
Architecture: x86_64
Install Date: Thu Jan 15 13:27:11 2026
Group       : default
Size        : 709132816
License     : AGPLv3
Signature   : RSA/SHA256, Tue Dec 16 23:08:56 2025, Key ID 963fa27710458545
Source RPM  : grafana-12.3.1-1.src.rpm
Build Date  : Tue Dec 16 17:30:38 2025
Build Host  : localhost
Relocations : /
Packager    : [email protected]
Vendor      : "Grafana Labs"
URL         : https://grafana.com
Summary     : Grafana
Description :
Grafana
Start and enable grafana service.
sudo systemctl enable --now grafana-serverUse systemctl command to check status of the service.
$ systemctl status grafana-server.service
● grafana-server.service - Grafana instance
     Loaded: loaded (/usr/lib/systemd/system/grafana-server.service; enabled; preset: disabled)
     Active: active (running) since Thu 2026-01-15 13:29:29 EAT; 46s ago
       Docs: http://docs.grafana.org
   Main PID: 3707 (grafana)
      Tasks: 15 (limit: 4643)
     Memory: 137.8M
        CPU: 4.509s
     CGroup: /system.slice/grafana-server.service
             └─3707 /usr/share/grafana/bin/grafana server --config=/etc/grafana/grafana.ini --pidfile=/var/run/grafana/grafana-server.pid --packaging=rpm cfg:default.paths.logs=/var/log/grafana cfg:default.paths.data=>

Jan 15 13:29:32 al-2023 grafana[3707]: logger=plugin.backgroundinstaller t=2026-01-15T13:29:32.485824517+03:00 level=info msg="Installing plugin" pluginId=grafana-lokiexplore-app version=
...
Access Grafana Web console
If you have a running firewalld service make sure you allow port 3000/tcp.
sudo firewall-cmd --add-port=3000/tcp --permanent
sudo firewall-cmd --reload
Open a web browser to access Grafana web console – http://grafana_server_hostname_or_IP_address:3000/
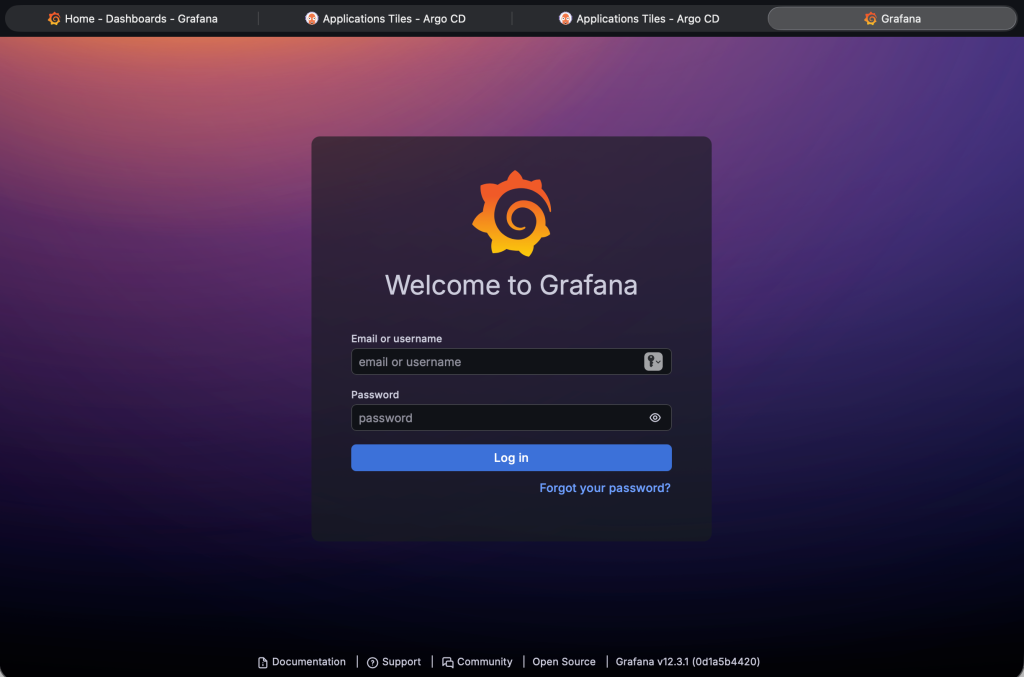
The default login credentials are:
Username: admin
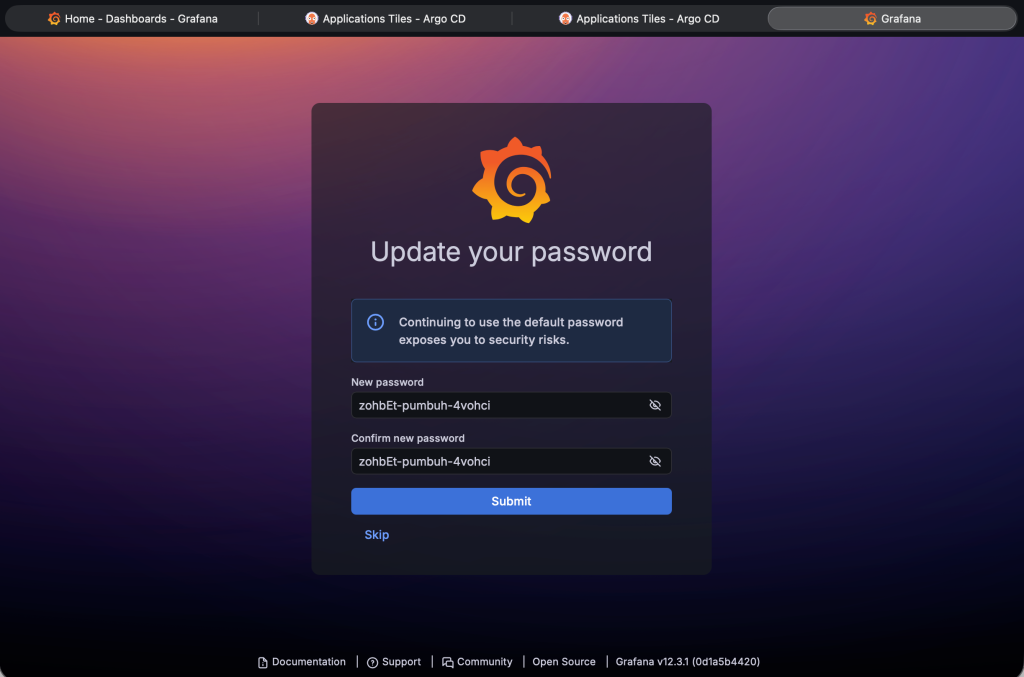
Password: adminReset admin password after initial login.
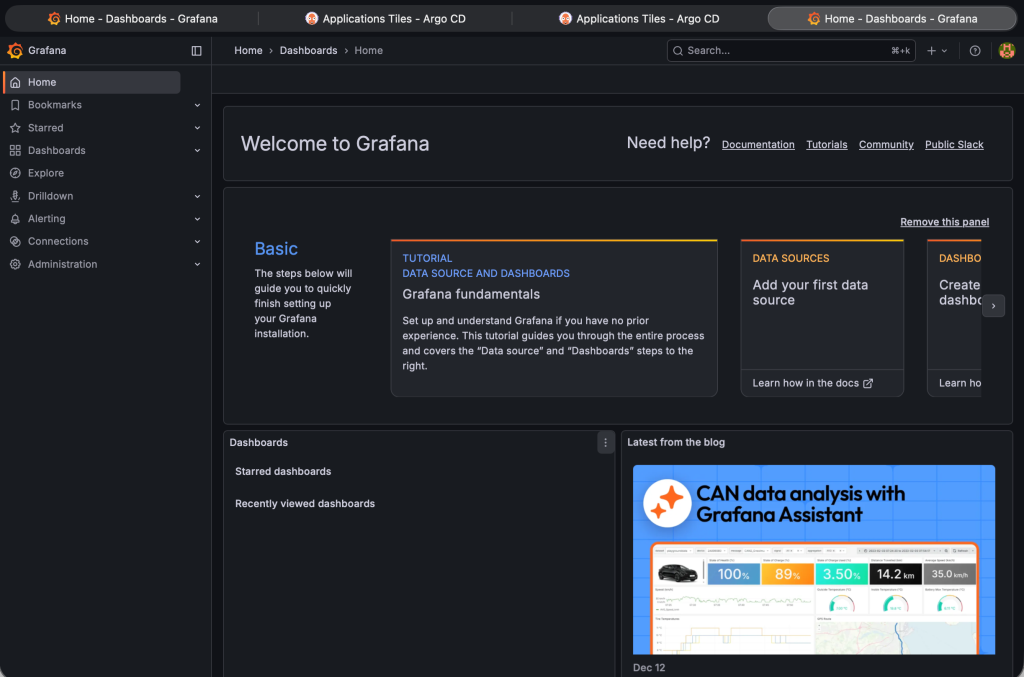
Your Grafana server is now ready for data visualization.
Keep visiting our website to get latest articles on monitoring and other technologies.