

Welcome to today’s guide on the installation of Prometheus on Amazon Linux 2023 server. Prometheus is a free to use and an open-source systems monitoring and alerting toolkit originally built at SoundCloud. Since its original inception many companies have adopted Prometheus hence the growth of its user community. Prometheus is now a standalone project maintained and developed by the open source community. Prometheus joined the Cloud Native Computing Foundation in 2016 as the second hosted project, after Kubernetes.
Below are the main features of Prometheus monitoring tool.
- a multi-dimensional data model with time series data identified by metric name and key/value pairs
- PromQL, a flexible query language to leverage this dimensionality
- no reliance on distributed storage; single server nodes are autonomous
- time series collection happens via a pull model over HTTP
- pushing time series is supported via an intermediary gateway
- targets are discovered via service discovery or static configuration
- multiple modes of graphing and dashboarding support
Install Prometheus on Amazon Linux 2023
Prometheus collects metrics from configured targets at given intervals, evaluates rule expressions, displays the results, and can trigger alerts if some condition is observed to be true.
You can install prometheus from a binary file downloadable from the Project website or by using packagecloud YUM repository.
For the YUM repository method we’ll use Packagecloud. Run the following commands in your terminal to add the repository to your Amazon Linux 2 machine.
sudo tee /etc/yum.repos.d/prometheus.repo > /dev/null <<'EOF'
[prometheus]
name=prometheus
baseurl=https://packagecloud.io/prometheus-rpm/release/el/9/x86_64
repo_gpgcheck=1
enabled=1
gpgkey=https://packagecloud.io/prometheus-rpm/release/gpgkey
       https://raw.githubusercontent.com/lest/prometheus-rpm/master/RPM-GPG-KEY-prometheus-rpm
gpgcheck=1
metadata_expire=300
EOF
The update from the added repository:
sudo yum updateAgree to import the repository GPG keys:
Importing GPG key 0x7457CCD1:
 Userid     : "https://packagecloud.io/prometheus-rpm/centos (https://packagecloud.io/docs#gpg_signing) <[email protected]>"
 Fingerprint: D7DF C575 AF4B 92C6 E62A D3C5 F721 6757 7457 CCD1
 From       : https://packagecloud.io/prometheus-rpm/release/gpgkey
Is this ok [y/N]: y
prometheus                                                                                                                                                                                5.9 kB/s | 3.0 kB     00:00
Importing GPG key 0x168A1EA1:
 Userid     : "prometheus-rpm <[email protected]>"
 Fingerprint: C7B7 CCCB BE77 86A4 9DF8 E28D 3A09 16E8 168A 1EA1
 From       : https://raw.githubusercontent.com/lest/prometheus-rpm/master/RPM-GPG-KEY-prometheus-rpm
Is this ok [y/N]: y
After adding the YUM repository install Prometheus and Node exporter using the following commands:
sudo yum install prometheus node_exporterProceed with package installation:
Last metadata expiration check: 0:02:24 ago on Thu Jan 15 13:43:41 2026.
Dependencies resolved.
==========================================================================================================================================================================================================================
 Package                                                Architecture                                    Version                                                 Repository                                           Size
==========================================================================================================================================================================================================================
Installing:
 node_exporter                                          x86_64                                          1.9.0-1.el9                                             prometheus                                          4.8 M
 prometheus2                                            x86_64                                          2.55.1-1.el9                                            prometheus                                           43 M

Transaction Summary
==========================================================================================================================================================================================================================
Install  2 Packages

Total download size: 48 M
Installed size: 240 M
Is this ok [y/N]: y
Also agree to import the package GPG keys:
Importing GPG key 0x7457CCD1:
 Userid     : "https://packagecloud.io/prometheus-rpm/centos (https://packagecloud.io/docs#gpg_signing) <[email protected]>"
 Fingerprint: D7DF C575 AF4B 92C6 E62A D3C5 F721 6757 7457 CCD1
 From       : https://packagecloud.io/prometheus-rpm/release/gpgkey
Is this ok [y/N]: y
Importing GPG key 0x168A1EA1:
 Userid     : "prometheus-rpm <[email protected]>"
 Fingerprint: C7B7 CCCB BE77 86A4 9DF8 E28D 3A09 16E8 168A 1EA1
 From       : https://raw.githubusercontent.com/lest/prometheus-rpm/master/RPM-GPG-KEY-prometheus-rpm
Is this ok [y/N]: y
You can use rpm command to check for the version of Prometheus installed.
$ rpm -qi prometheus2
Name        : prometheus2
Version     : 2.55.1
Release     : 1.el9
Architecture: x86_64
Install Date: Thu Jan 15 13:47:24 2026
Group       : Unspecified
Size        : 234974724
License     : ASL 2.0
Signature   : RSA/SHA256, Tue Feb 25 18:12:50 2025, Key ID 3a0916e8168a1ea1
Source RPM  : prometheus2-2.55.1-1.el9.src.rpm
Build Date  : Tue Feb 25 18:03:19 2025
Build Host  : 2a6b0f9519a5
URL         : https://prometheus.io
Summary     : The Prometheus monitoring system and time series database.
Description :

Prometheus is a systems and service monitoring system. It collects metrics from
configured targets at given intervals, evaluates rule expressions, displays the
results, and can trigger alerts if some condition is observed to be true.
Configure basic settings by editing the prometheus.yml file.
sudo vim /etc/prometheus/prometheus.ymlI’ll set it to monitor the local server using the node exporter we installed.
# my global config
global:
  scrape_interval:     15s # Set the scrape interval to every 15 seconds. Default is every 1 minute.
  evaluation_interval: 15s # Evaluate rules every 15 seconds. The default is every 1 minute.
  # scrape_timeout is set to the global default (10s).

# Alertmanager configuration
alerting:
  alertmanagers:
  - static_configs:
    - targets:
      # - alertmanager:9093

# Load rules once and periodically evaluate them according to the global 'evaluation_interval'.
rule_files:
  # - "first_rules.yml"
  # - "second_rules.yml"

# A scrape configuration containing exactly one endpoint to scrape:
# Here it's Prometheus itself.
scrape_configs:
  # The job name is added as a label `job=<job_name>` to any timeseries scraped from this config.
  - job_name: "prometheus"

    # metrics_path defaults to '/metrics'
    # scheme defaults to 'http'.

    static_configs:
    - targets: ['localhost:9090']
  # Pull host metrics with node exporter
  - job_name: 'node_exporter'
    static_configs:
      - targets: ['localhost:9100']
Restart prometheus and node_exporter services.
sudo systemctl restart prometheus node_exporterAlso set the services to start at host boot.
$ sudo systemctl enable prometheus node_exporter
Created symlink from /etc/systemd/system/multi-user.target.wants/prometheus.service to /usr/lib/systemd/system/prometheus.service.
Created symlink from /etc/systemd/system/multi-user.target.wants/node_exporter.service to /usr/lib/systemd/system/node_exporter.service.
Check if the services are in running state.
$ systemctl status prometheus node_exporter
● prometheus.service - The Prometheus monitoring system and time series database.
     Loaded: loaded (/usr/lib/systemd/system/prometheus.service; enabled; preset: disabled)
     Active: active (running) since Thu 2026-01-15 14:17:13 EAT; 46s ago
       Docs: https://prometheus.io
   Main PID: 4021 (prometheus)
      Tasks: 8 (limit: 4643)
     Memory: 19.7M
        CPU: 79ms
     CGroup: /system.slice/prometheus.service
             └─4021 /usr/bin/prometheus --config.file=/etc/prometheus/prometheus.yml --storage.tsdb.path=/var/lib/prometheus/data --web.console.libraries=/usr/share/prometheus/console_libraries --web.console.templates>

Jan 15 14:17:13 al-2023 prometheus[4021]: ts=2026-01-15T11:17:13.308Z caller=head.go:722 level=info component=tsdb msg="Replaying WAL, this may take a while"
Jan 15 14:17:13 al-2023 prometheus[4021]: ts=2026-01-15T11:17:13.308Z caller=head.go:794 level=info component=tsdb msg="WAL segment loaded" segment=0 maxSegment=0
Jan 15 14:17:13 al-2023 prometheus[4021]: ts=2026-01-15T11:17:13.308Z caller=head.go:831 level=info component=tsdb msg="WAL replay completed" checkpoint_replay_duration=15.454µs wal_replay_duration=155.702µs wbl_repla>
Jan 15 14:17:13 al-2023 prometheus[4021]: ts=2026-01-15T11:17:13.310Z caller=main.go:1218 level=info fs_type=XFS_SUPER_MAGIC
Jan 15 14:17:13 al-2023 prometheus[4021]: ts=2026-01-15T11:17:13.310Z caller=main.go:1221 level=info msg="TSDB started"
Jan 15 14:17:13 al-2023 prometheus[4021]: ts=2026-01-15T11:17:13.310Z caller=main.go:1404 level=info msg="Loading configuration file" filename=/etc/prometheus/prometheus.yml
Jan 15 14:17:13 al-2023 prometheus[4021]: ts=2026-01-15T11:17:13.403Z caller=main.go:1441 level=info msg="updated GOGC" old=100 new=75
Jan 15 14:17:13 al-2023 prometheus[4021]: ts=2026-01-15T11:17:13.403Z caller=main.go:1452 level=info msg="Completed loading of configuration file" filename=/etc/prometheus/prometheus.yml totalDuration=93.397441ms db_s>
Jan 15 14:17:13 al-2023 prometheus[4021]: ts=2026-01-15T11:17:13.403Z caller=main.go:1182 level=info msg="Server is ready to receive web requests."
Jan 15 14:17:13 al-2023 prometheus[4021]: ts=2026-01-15T11:17:13.403Z caller=manager.go:164 level=info component="rule manager" msg="Starting rule manager..."

● node_exporter.service - Prometheus exporter for machine metrics, written in Go with pluggable metric collectors.
     Loaded: loaded (/usr/lib/systemd/system/node_exporter.service; enabled; preset: disabled)
     Active: active (running) since Thu 2026-01-15 14:17:13 EAT; 46s ago
       Docs: https://github.com/prometheus/node_exporter
   Main PID: 4026 (node_exporter)
      Tasks: 4 (limit: 4643)
     Memory: 6.7M
        CPU: 39ms
     CGroup: /system.slice/node_exporter.service
             └─4026 /usr/bin/node_exporter

Jan 15 14:17:13 al-2023 node_exporter[4026]: time=2026-01-15T11:17:13.279Z level=INFO source=node_exporter.go:141 msg=time
Jan 15 14:17:13 al-2023 node_exporter[4026]: time=2026-01-15T11:17:13.279Z level=INFO source=node_exporter.go:141 msg=timex
Jan 15 14:17:13 al-2023 node_exporter[4026]: time=2026-01-15T11:17:13.279Z level=INFO source=node_exporter.go:141 msg=udp_queues
Jan 15 14:17:13 al-2023 node_exporter[4026]: time=2026-01-15T11:17:13.279Z level=INFO source=node_exporter.go:141 msg=uname
Jan 15 14:17:13 al-2023 node_exporter[4026]: time=2026-01-15T11:17:13.279Z level=INFO source=node_exporter.go:141 msg=vmstat
Jan 15 14:17:13 al-2023 node_exporter[4026]: time=2026-01-15T11:17:13.279Z level=INFO source=node_exporter.go:141 msg=watchdog
Jan 15 14:17:13 al-2023 node_exporter[4026]: time=2026-01-15T11:17:13.279Z level=INFO source=node_exporter.go:141 msg=xfs
Jan 15 14:17:13 al-2023 node_exporter[4026]: time=2026-01-15T11:17:13.279Z level=INFO source=node_exporter.go:141 msg=zfs
Jan 15 14:17:13 al-2023 node_exporter[4026]: time=2026-01-15T11:17:13.280Z level=INFO source=tls_config.go:347 msg="Listening on" address=[::]:9100
Jan 15 14:17:13 al-2023 node_exporter[4026]: time=2026-01-15T11:17:13.280Z level=INFO source=tls_config.go:350 msg="TLS is disabled." http2=false address=[::]:9100
If you have firewalld running enable prometheus service.
sudo firewall-cmd --add-service=prometheus --permanent
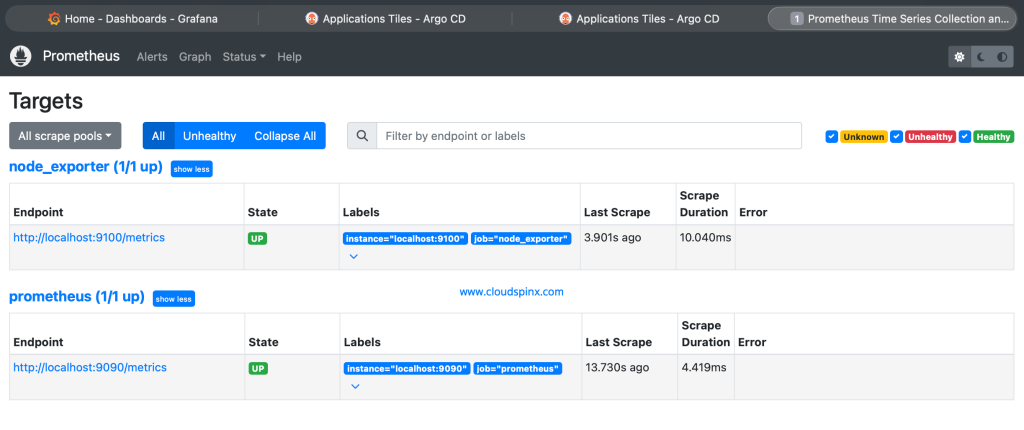
sudo firewall-cmd --reloadAccess the Prometheus Web UI on http://server_hostname_or_IP_Address:9090/ from your client machine.
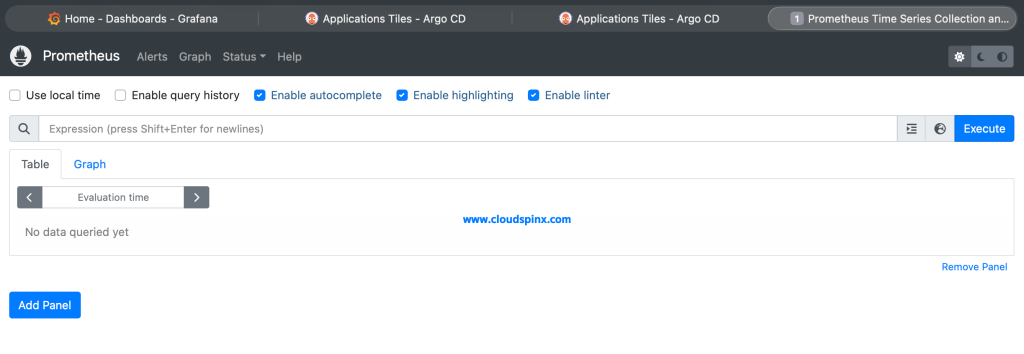
This is a confirmation that Prometheus server is working as expected.
Our next guide will go into detail on monitoring server uptime with Prometheus. And in later series into metrics graphing with Grafana.s
Other Monitoring guides: