
Monitoring is the process of ensuring that you keep track of the performance of your IT infrastructure. This includes servers, CPUs, storage, computer hardware and software, security, network, etc. A system administrator or a network administrator would check up on the resources to ensure that they are up and running well without any issues. If there is a problem identified, it can be resolved in the minimum time possible without affecting the whole operation. This might be cumbersome if you do not have a system to help you identify such problems quickly so as to curb them without making losses or stalling operations.
This is where monitoring tools come in. Monitoring tools capture log files created by applications that include the time and date an event occurred, Users logged into a machine, the source of the event, and a description of the event type. With this and other types of information captured from different sources, organizations can identify operational issues, Deployment problems, and possible security breaches. Data collected can be used to expand a business in areas where an opportunity appears and identify any additional capacity required.
In Linux systems, there are different types of Monitoring tools used to monitor the system. They include Prometheus, Sarg, Observium, Cacti, Wireshark, OpenNMS, Nagios Core, Zabbix, Datadog, LibreNMS, Grafana, Glances, and more.
Monitoror
Monitoror is a monitoring app written in GO that runs in Linux, Windows, and macOS to monitor server status, monitor CI build progress, or even display critical values. It is a unified monitoring wallboard that is light, ergonomic, and reliable to monitor anything. It is integrated with the most popular services like GitLab, GitHub, Azure DevOps, Pingdom, Jenkins, and Travis CI to support monitorable tiles that show the status of builds, releases, pull requests, Ping status of a hostname, check if a port is open, and display search issues counters. It is divided into two parts;
- Core – Core is the server-side Monitoror’s HTTP API, configured by the .env file.
- UI – It is the client-side Monitoror, which is the wallboard itself, loaded in a browser. It is colorful and clear to provide precise spotting of an issue at a glance.
Monitoror is highly customizable with extending features that allow it to shape the wallboard to how it fits you the most. They include;
- Dark Theme supported
- Custom labels
- Stretch tiles across multiple rows/columns
- Multiple CI instances support
- Group things in one tile to save space and get the global status of sub-tiles.
Step 1: Install Monitoror on Linux
Create a directory to store the monitor files:
mkdir -p /opt/monitoror
cd /opt/monitoror
Download the latest release of Monitoror for Linux x64 from the Download page or use the curl utility.
VER=$(curl -s https://api.github.com/repos/monitoror/monitoror/releases/latest|grep tag_name|cut -d '"' -f 4|sed 's/v//')
wget -O monitoror https://github.com/monitoror/monitoror/releases/download/${VER}/monitoror-linux-amd64-${VER}
Configure the UI with a JSON configuration file to define when you want to display it. It should be saved in the directory where the binary file is located.
vim config.jsonAs a starting point use the following template.
{
  "version": "2.0",
  "columns": 2,
  "tiles": [
    {
      "type": "PORT",
      "label": "Welcome config example",
      "params": {
        "hostname": "127.0.0.1",
        "port": 8080
      }
    },
    {
      "type": "HTTP-RAW",
      "label": "Monitoror stars",
      "params": {
        "url": "https://github.com/monitoror/monitoror",
        "regex": "(\\d+) users starred"
      }
    }
  ]
}
Configure the Core with the UI configuration using the .env file.
$ sudo vim .env
MO_CONFIG="./config.json"
Make Monitoror executable.
chmod +x monitororThen Run Monitoror with the following command.
$ ./monitoror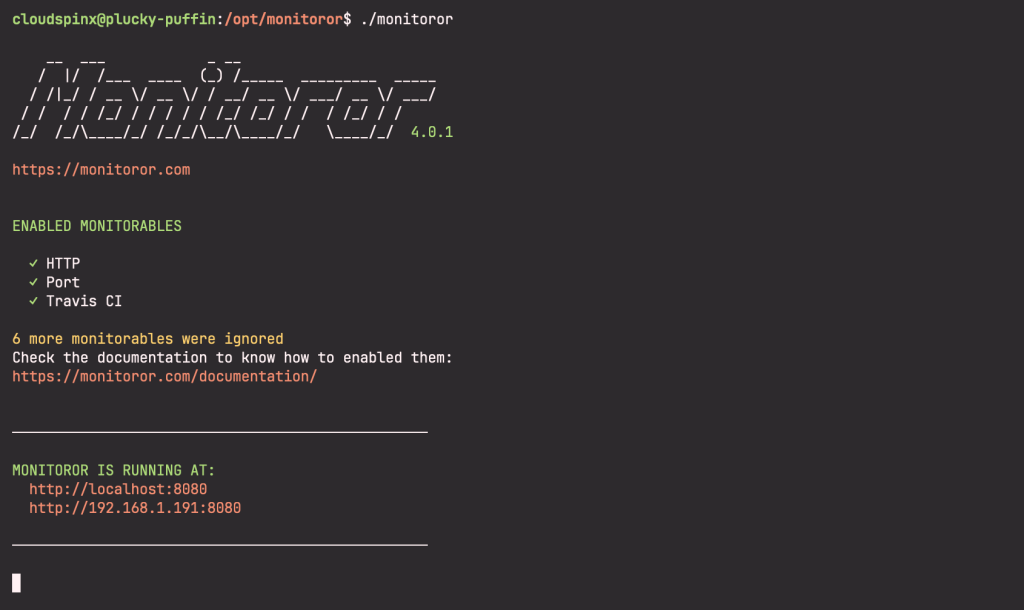
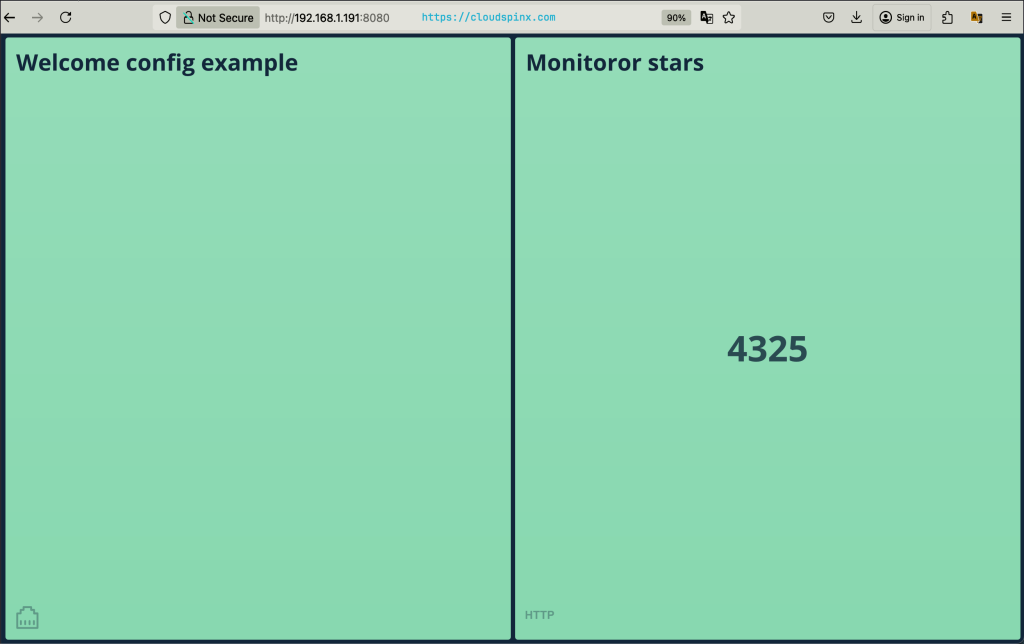
Once the core is running, Go to http://localhost:8080/ to access the UI:
Step 2: Configure Monitoror
There are two ways of configuring Monitoror.
- Core configuration includes credentials, timeouts, cache, etc
- UI configuration involves tiles and layout definition.
Core Configuration
To configure the Monitoror Core Configuration, we edit the .env file which should be within the same directory as the monitoror binary file.
There are different options that can be changed from the file which include;
port numberwhich is the application port. The default port is 8080application addressthat can be used to listen to a particular network interface instead of all, the default is0.0.0.0
If I wanted to change the port number and application address. I would use the following syntax in the .env file.
MO_PORT=8888UI configuration
The UI configuration is stored in a .json file in the directory where the monitoror application resides. It covers the tiles and layout definition.
The root properties that are required and should be included in a config.json file are;
- `version string` – which is the configuration format version. The current version is “2.0”.
columns number– which is the number of columns the grid is based on.zoom number– zoom factor applied to all tiles. DEFAULT: 1tiles– Tile which is the list of tile definitions.
A sample configuration file is like the one I used above to start up the monitoror with the version, columns, and tiles parameters. Then under the port tile, I would edit the port that I have changed in the .env file to 8888.
{
  "version": "2.0",
  "columns": 2,
  "tiles": [
    {
      "type": "PORT",
      "label": "Welcome config example",
      "params": {
        "hostname": "127.0.0.1",
        "port": 8888
      }
    },
    {
      "type": "HTTP-RAW",
      "label": "Monitoror stars",
      "params": {
        "url": "https://github.com/monitoror/monitoror",
        "regex": "(\\d+) users starred"
      }
    }
  ]
}
Save and exit the file.
If you open the UI again on http:localhost:8888, you will see the UI on the changed port.
Monitorable tiles
Monitorable tiles allow you to integrate with popular tools that you can use to set up your UI. They include the following;
- Azure DevOps that includes both the AZUREDEVOPS-BUILD and the AZUREDEVOPS-RELEASE to show the status of builds and releases
- GitHub that shows branch or pull requests checks status and displays search result counters.
- GitLab to show to branch or merge request pipeline status and display search issues counters.
- HTTP that sends a GET request to a URL and then checks the status code and the content.
- Jenkins tiles are used to display the status of a build or pipeline.
- PING to get ping status and duration from a hostname.
- Pingdom to check interface with pingdom.com/website-monitoring.
- A PORT that checks if a port is open with something listening behind.
- Travis CI to show Travis CI build status and progress.
Each monitorable has specific parameters attached to it that are used to configure the core and UI configuration files. You can check them out under Monitorable tiles.
Anytime you add a monitorable with its parameters and restart the core, It is picked up automatically and will show on the UI. To configure a monitorable, you should edit the .env file with the required parameters. Then edit the UI configuration which is the .json file under the tiles section with the tiles part.
Let us integrate with the PING monitorable. Edit the core configuration file which is the .env file with the following details to get the ping status and duration from the hostname.
- Ping Count that gets the number of ping sent, used to retrieve an average value
- Ping Interval to get the interval between ping in milliseconds
- Ping Timeout to get the global time in milliseconds before returning the error
MO_MONITORABLE_PING_COUNT=2
MO_MONITORABLE_PING_INTERVAL=100
MO_MONITORABLE_PING_TIMEOUT=1000
Save the file and exit.
The UI configuration file config.json shows the ping to a hostname status and duration. Under the tiles parameter, add the following line
{
"type": "PING",
"label": "Localhost",
"params": {
"hostname": "localhost"
}
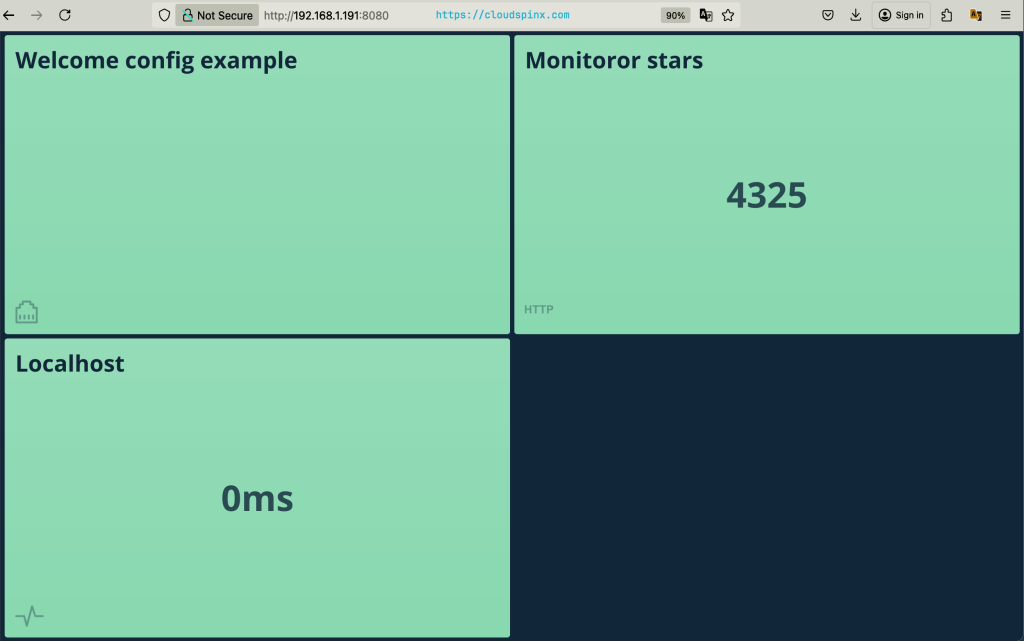
}In the end, my UI configuration file is shown below.
{
  "version": "2.0",
  "columns": 2,
  "tiles": [
    {
      "type": "PORT",
      "label": "Welcome config example",
      "params": {
        "hostname": "127.0.0.1",
        "port": 8080
      }
    },
    {
      "type": "HTTP-RAW",
      "label": "Monitoror stars",
      "params": {
        "url": "https://github.com/monitoror/monitoror",
        "regex": "(\\d+) users starred"
      }
    },
     {
       "type": "PING",
       "label": "Localhost",
       "params": {
         "hostname": "localhost"
     }
   }
  ]
}
Save and exit the file.
If you see PING: disabled at Monitoror launch, you need to relaunch Monitoror as a super-user to get PING tiles working.
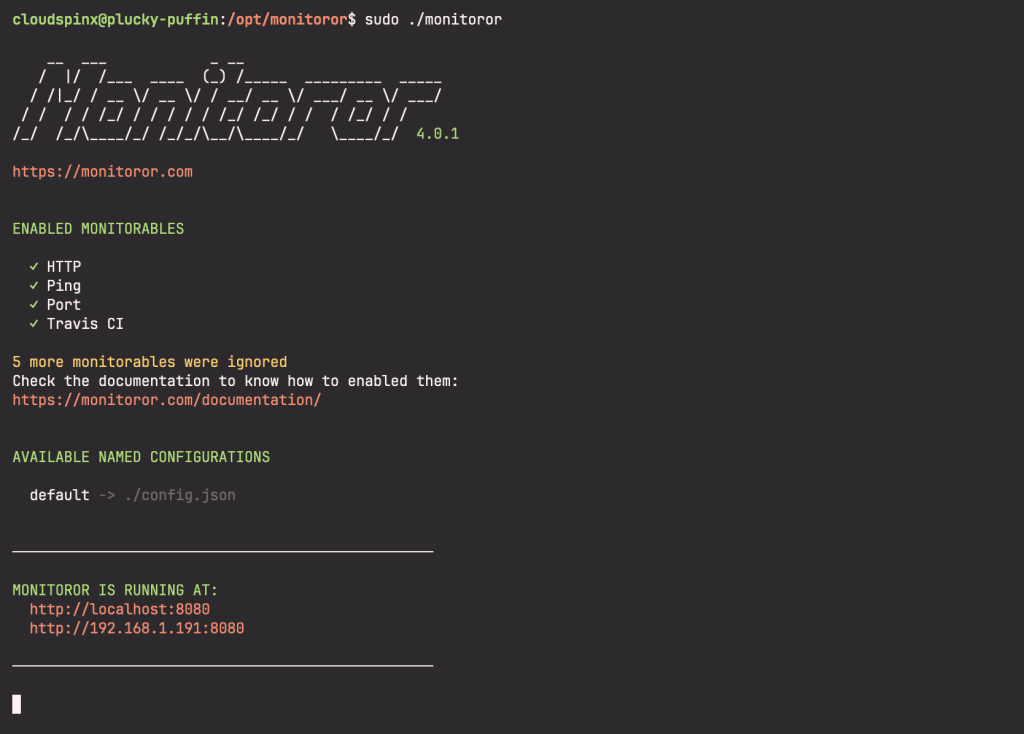
As you see above, the PING monitorable tile has been enabled. Then view the added tile on http://localhost:8888.
Run Monitoror in Docker
Prerequisite: Docker is installed on your System.
Then run the following command to pull the Monitoror image from DockerHub.
docker run -p 8080:8080 monitoror/monitororSample output will have the container running with no environment variables configured to it.
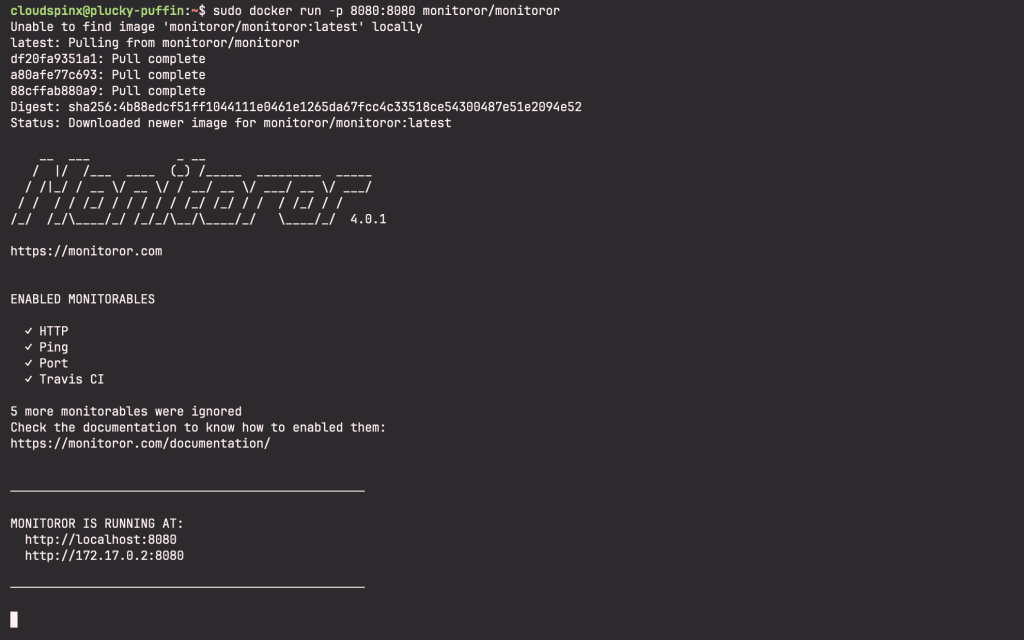
So when you acess the monitoror web UI, you are greeted with the instructions on how to configure your UI.
Environment variables are passed to the run command for configuring a Monitoror container with the following syntax.
$ sudo docker run -it --rm \
  --name monitoror \
  -p 8080:8080 \
  -e MO_CONFIG="/app/config/config.json" \
  -v ./config.json:/app/config/config.json \
  monitoror/monitoror
Sample Output.
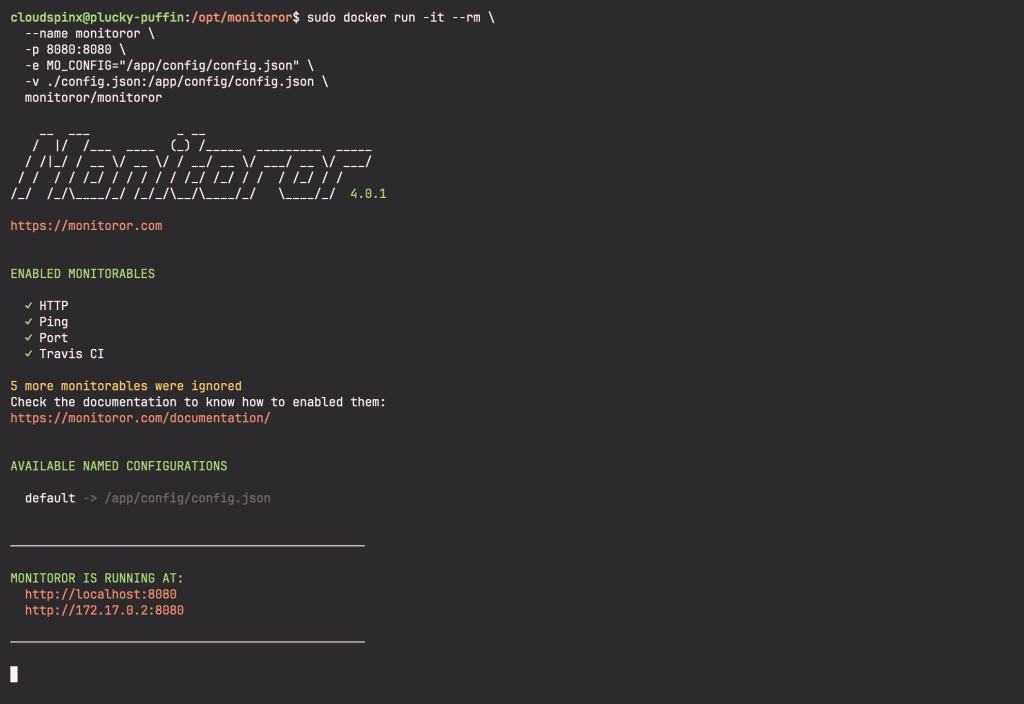
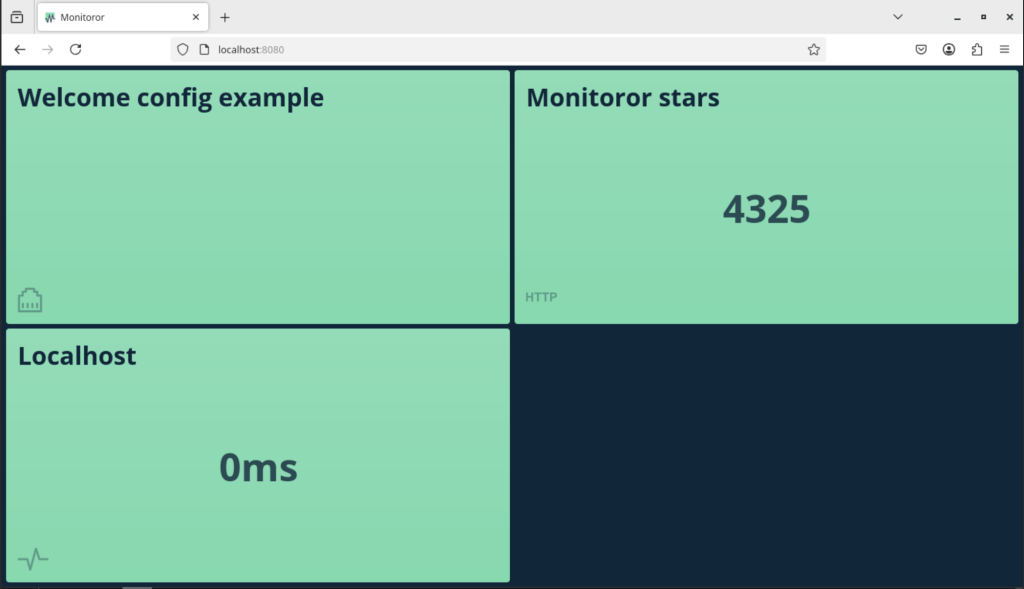
Go to http://localhost:8080 to access the UI.
Conclusion
Monitoror is a unified monitoring wallboard that monitors anything on your system, From checking server status, checking a port to ensure that something is listening behind to CI builds progress, Monitoror provides a light, reliable and ergonomic system with dependable and clean wallboard to capture information from different sources. It integrates with popular tools like Gitlab, GitHub Azure DevOps, Pingdom, Jenkins, and Travis CI to show the status of releases, builds, pull requests, and display search issue counters.
More articles from us: