
We all know that CentOS 7 is near its end of life, which is schedule for June 30, 2024. If you are looking for the installation guide of Prometheus and Grafana on CentOS 7 or RHEL 7 Linux system, this article has been created for you. Prometheus and Grafana are a perfect combination software solutions for monitoring your IT infrastructure – systems and applications. The work differently but with the aim of ensuring you experience seamless monitoring and providing deep insights regarding the performance and health of your systems.
Prometheus will do the scraping of metrics such as system CPU and Memory usage, or API request counts and store in its time series database. The data is made available to Grafana for querying and visualization. Grafana consumes raw metrics data and present it in dashboards, charts, graphs and other visualizations. Grafana makes it easy to spot anomalies, analyze performance trends and monitor the general health of your critical applications.
We are providing straightforward steps to enable you install, configure, and use both Prometheus and Grafana on CentOS 7 / RHEL 7. The procedure is outlined as below.
If the CentOS 7 repositories are no working, check out the following article:
Step 1: Add Prometheus RPM repository
The easiest installation method of Prometheus is from a RPM repository. Add it to the system by executing the following commands.
curl -s https://packagecloud.io/install/repositories/prometheus-rpm/release/script.rpm.sh | sudo bashConfirmation of successful repository addition can be done by listing repos available in the system.
$ sudo yum -y repolist  | grep prometheus
prometheus-rpm_release/x86_64 prometheus-rpm_release                         899
prometheus-rpm_release-source prometheus-rpm_release-source                    0
Step 2: Install Prometheus on CentOS 7 / RHEL 7
We confirmed the repository was added successfully into the system, let’s now install Prometheus on CentOS 7 / RHEL 7.
sudo yum -y install prometheus2 node_exportThere are a number of exporters available in the repository, this can be listed using.
$ sudo yum  search _exporter
Loaded plugins: fastestmirror
Loading mirror speeds from cached hostfile
 * base: ftp.funet.fi
 * epel: mirror.cspacehostings.com
 * extras: ftp.funet.fi
 * remi-php81: mirror.23m.com
 * remi-safe: mirror.23m.com
 * updates: ftp.ember.se
======================================================================================= N/S matched: _exporter =======================================================================================
apache_exporter.x86_64 : Prometheus exporter Apache webserver mertics.
artifactory_exporter.x86_64 : Prometheus exporter for JFrog Artifactory stats.
bareos_exporter.x86_64 : Prometheus exporter for BareOS data recovery system
bind_exporter.x86_64 : Prometheus exporter for Bind nameserver
blackbox_exporter.x86_64 : Blackbox prober exporter
collectd_exporter.x86_64 : Collectd stats exporter for Prometheus.
consul_exporter.x86_64 : Consul stats exporter for Prometheus.
couchbase_exporter.x86_64 : Prometheus exporter for Couchbase server metrics.
dellhw_exporter.x86_64 : Dell Hardware OMSA exporter
domain_exporter.x86_64 : Prometheus exporter for domain expiration time metrics
ebpf_exporter.x86_64 : Prometheus exporter for custom eBPF metrics
elasticsearch_exporter.x86_64 : Elasticsearch stats exporter for Prometheus.
exim_exporter.x86_64 : Prometheus exporter for the exim4 mail server.
exporter_exporter.x86_64 : Simple reverse proxy for Prometheus exporters
frr_exporter.x86_64 : Prometheus exporter for FRR metrics
graphite_exporter.x86_64 : Server that accepts metrics via the Graphite protocol and exports them as Prometheus metrics.
haproxy_exporter.x86_64 : This is a simple server that scrapes HAProxy stats and exports them via HTTP for Prometheus consumption.
influxdb_exporter.x86_64 : InfluxDB stats exporter for Prometheus.
iperf3_exporter.x86_64 : Prometheus exporter for iPerf3 probing.
ipmi_exporter.x86_64 : Prometheus exporter for IPMI metrics
jmx_exporter.noarch : Prometheus exporter for mBeans scrape and expose.
jolokia_exporter.x86_64 : Prometheus exporter for jolokia metrics
json_exporter.x86_64 : A Prometheus exporter which scrapes remote JSON by JSONPath.
junos_exporter.x86_64 : Prometheus exporter for Junos device metrics.
kafka_exporter.x86_64 : Kafka exporter for Prometheus.
keepalived_exporter.x86_64 : Prometheus exporter for Keepalived metrics
memcached_exporter.x86_64 : Memcached stats exporter for Prometheus.
mongodb_exporter.x86_64 : A Prometheus exporter for MongoDB including sharding, replication and storage engines
mysqld_exporter.x86_64 : Prometheus exporter for MySQL server metrics.
nats_exporter.x86_64 : A prometheus exporter for NATS
nginx_exporter.x86_64 : NGINX Prometheus Exporter for NGINX and NGINX Plus.
node_exporter.x86_64 : Prometheus exporter for machine metrics, written in Go with pluggable metric collectors.
openstack_exporter.x86_64 : Prometheus exporter for OpenStack metrics.
pgbouncer_exporter.x86_64 : Prometheus exporter for PgBouncer.
phpfpm_exporter.x86_64 : A prometheus exporter for PHP-FPM. The exporter connects directly to PHP-FPM and exports the metrics via HTTP
ping_exporter.x86_64 : Ping exporter
postgres_exporter.x86_64 : Prometheus exporter for PostgreSQL server metrics
process_exporter.x86_64 : Process exporter for Prometheus.
rabbitmq_exporter.x86_64 : Prometheus exporter for RabbitMQ metrics
redis_exporter.x86_64 : Prometheus exporter for Redis server metrics.
snmp_exporter.x86_64 : Prometheus SNMP exporter.
sql_exporter.x86_64 : SQL exporter
squid_exporter.x86_64 : Prometheus Squid proxy metric exporter
ssl_exporter.x86_64 : Prometheus exporter for SSL certificates.
statsd_exporter.x86_64 : Export StatsD metrics in Prometheus format.
systemd_exporter.x86_64 : Prometheus exporter for systemd units, written in Go.
For example to install MySQL exporter use:
sudo yum -y install mysqld_exporterOther exporters can be installed in a similar manner.
sudo yum -y install <name>_exporterIf firewalld is active, allow Prometheus port.
sudo firewall-cmd --add-port=9090/tcp --permanent
sudo firewall-cmd --reload
Start and enable prometheus service.
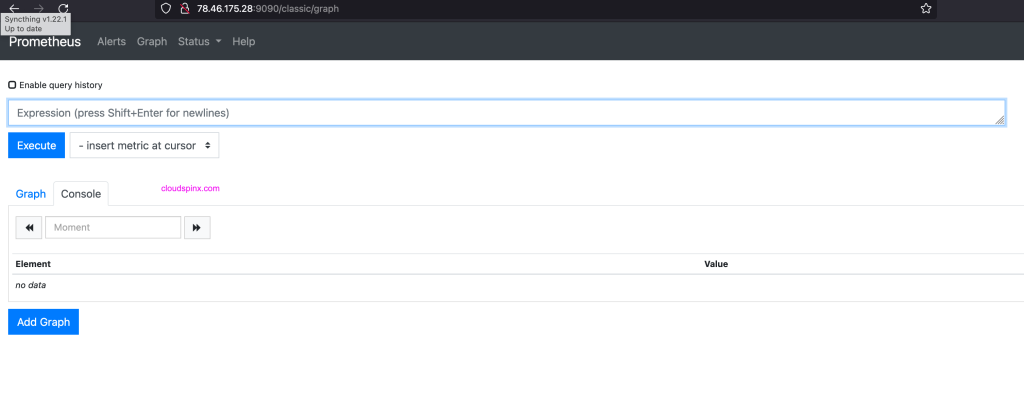
sudo systemctl enable --now prometheusPrometheus dashboard will be available at http://ServerIP:9090
Step 3: Add Grafana RPM repository
Installing Grafana from RPM repository makes it possible to update the software every time you update your applications / system.
Import repository GPG key.
wget -q -O gpg.key https://rpm.grafana.com/gpg.key
sudo rpm --import gpg.key
Create Grafana repository contents.
sudo tee /etc/yum.repos.d/grafana.repo<<EOF
[grafana]
name=grafana
baseurl=https://rpm.grafana.com
repo_gpgcheck=1
enabled=1
gpgcheck=1
gpgkey=https://rpm.grafana.com/gpg.key
sslverify=1
sslcacert=/etc/pki/tls/certs/ca-bundle.crt
EOF
Step 4: Install Grafana on CentOS 7 / RHEL 7
To install Grafana OSS in your CentOS system, run the following command:
sudo yum -y install grafanaStart and enable the service.
sudo systemctl enable --now grafana-serverAllow service on port 3000.
sudo firewall-cmd --add-port=3000/tcp --permanent
sudo firewall-cmd --reload
Access Grafana web dashboard on http://ServerIP:3000

Use default login username and password admin. Then change in the next screen.

Step 5: Add Prometheus to Grafana
Configure Grafana to access your Prometheus server for pulling metrics collected. To configure Prometheus as a Data Source in Grafana do;
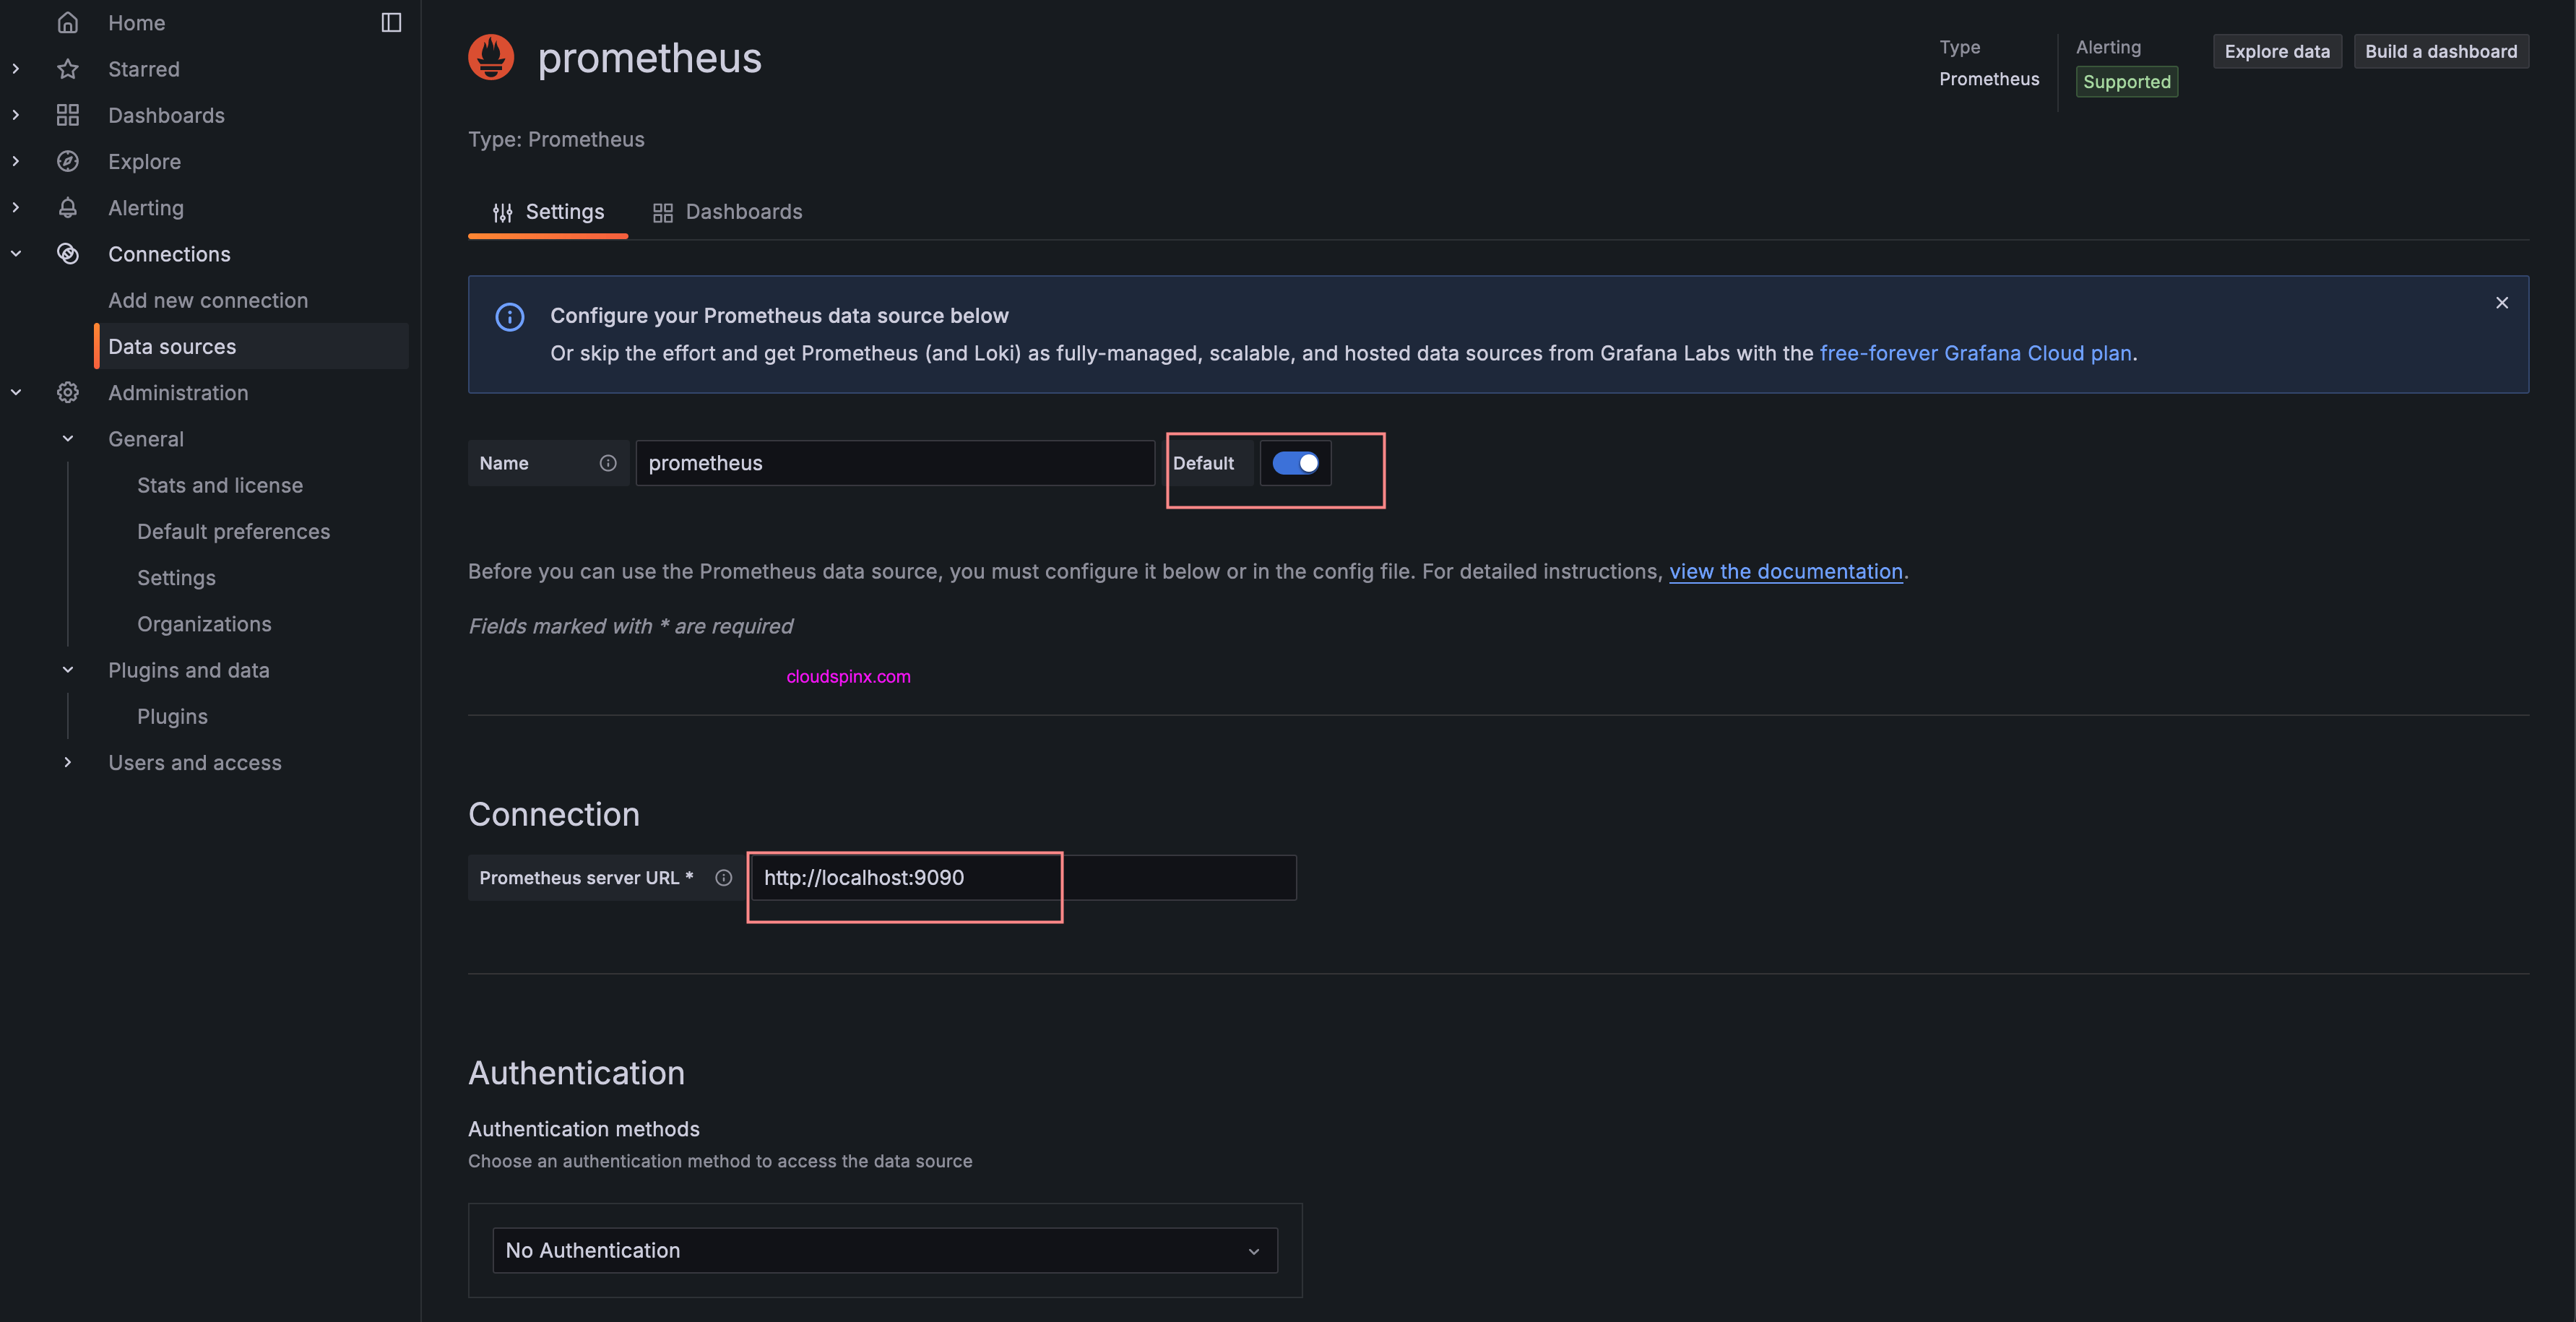
In the sidebar there is a cogwheel icon, click on it to open Configuration menu. Click “Data sources” under the “Connections” section. Prometheus is enabled by default.
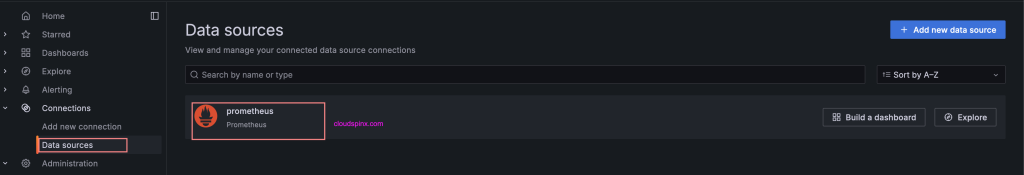
If you can’t see then add by clicking “Add new data source”. Once it is added open to edit its configurations.
We can set the data source as default, and input correct URL of your Prometheus installation.

To validate connectivity click “Save & Test“. This will update the settings and initiate connection from Grafana to Prometheus to test if successful.

Next start to build a dashboard, or by querying data in the Explore view.