Prometheus is a well adopted open-source monitoring solution common in infrastructure environments powered by microservices. It was originally developed by SoundCloud, but they later open sourced it. Prometheus excellence is in the collection and storage of time series data types. It is an ideal monitoring solution for various aspects of an IT infrastructure, different type of applications, and all manner of services.
PromQL is a Prometheus Query Language. It allows for querying and modification of time series data and the generation of customized alerts, tables, and graphs. Data can be stored in memory and on a local disk for faster access.
Alertmanager is used for handling alerting in Prometheus, it will do the grouping and routing of the alerts to the correct receiver integration such as email, PagerDuty, Slack, or other integrations. Alertmanager also does the silencing and inhibition of alerts.
1) Update System
Update your OS repository package list index.
sudo apt updateIf working on a system that’s not up-to-date, then consider performing a full upgrade.
sudo apt upgrade -y2) Install Prometheus on Ubuntu 24.04
Prometheus server and node exporter packages are available on the default Ubuntu repositories. Install it on your system by running the following commands.
sudo apt install prometheus prometheus-node-exporter -yConfigurations of Prometheus can be done by editing the file /etc/prometheus/prometheus.yml
sudo vim /etc/prometheus/prometheus.ymlYou can start and enable the services after the changes are made.
sudo systemctl enable --now prometheus prometheus-node-exporterConfirm of the services are running on the server.
systemctl status prometheus prometheus-node-exporterIf the installation was successful and services started you should get an output similar to below.
● prometheus.service - Monitoring system and time series database
     Loaded: loaded (/usr/lib/systemd/system/prometheus.service; enabled; preset: enabled)
     Active: active (running) since Tue 2024-06-11 22:17:31 UTC; 1min 27s ago
       Docs: https://prometheus.io/docs/introduction/overview/
             man:prometheus(1)
   Main PID: 4854 (prometheus)
      Tasks: 7 (limit: 2255)
     Memory: 22.6M (peak: 22.6M)
        CPU: 366ms
     CGroup: /system.slice/prometheus.service
             └─4854 /usr/bin/prometheus

Jun 11 22:17:31 noble prometheus[4854]: ts=2024-06-11T22:17:31.352Z caller=head.go:676 level=info component=tsdb msg="On-disk memory mappable chunks replay completed" duration=11.078µs
Jun 11 22:17:31 noble prometheus[4854]: ts=2024-06-11T22:17:31.352Z caller=head.go:684 level=info component=tsdb msg="Replaying WAL, this may take a while"
Jun 11 22:17:31 noble prometheus[4854]: ts=2024-06-11T22:17:31.354Z caller=head.go:755 level=info component=tsdb msg="WAL segment loaded" segment=0 maxSegment=0
Jun 11 22:17:31 noble prometheus[4854]: ts=2024-06-11T22:17:31.354Z caller=head.go:792 level=info component=tsdb msg="WAL replay completed" checkpoint_replay_duration=80.665µs wal_replay_duration=1>
Jun 11 22:17:31 noble prometheus[4854]: ts=2024-06-11T22:17:31.358Z caller=main.go:1025 level=info fs_type=EXT4_SUPER_MAGIC
Jun 11 22:17:31 noble prometheus[4854]: ts=2024-06-11T22:17:31.358Z caller=main.go:1028 level=info msg="TSDB started"
Jun 11 22:17:31 noble prometheus[4854]: ts=2024-06-11T22:17:31.358Z caller=main.go:1209 level=info msg="Loading configuration file" filename=/etc/prometheus/prometheus.yml
Jun 11 22:17:31 noble prometheus[4854]: ts=2024-06-11T22:17:31.360Z caller=main.go:1246 level=info msg="Completed loading of configuration file" filename=/etc/prometheus/prometheus.yml totalDuratio>
Jun 11 22:17:31 noble prometheus[4854]: ts=2024-06-11T22:17:31.360Z caller=main.go:989 level=info msg="Server is ready to receive web requests."
Jun 11 22:17:31 noble prometheus[4854]: ts=2024-06-11T22:17:31.360Z caller=manager.go:999 level=info component="rule manager" msg="Starting rule manager..."

● prometheus-node-exporter.service - Prometheus exporter for machine metrics
     Loaded: loaded (/usr/lib/systemd/system/prometheus-node-exporter.service; enabled; preset: enabled)
     Active: active (running) since Tue 2024-06-11 22:17:21 UTC; 1min 37s ago
       Docs: https://github.com/prometheus/node_exporter
   Main PID: 4013 (prometheus-node)
      Tasks: 5 (limit: 2255)
     Memory: 7.3M (peak: 8.2M)
        CPU: 457ms
     CGroup: /system.slice/prometheus-node-exporter.service
             └─4013 /usr/bin/prometheus-node-exporter

Jun 11 22:17:21 noble prometheus-node-exporter[4013]: ts=2024-06-11T22:17:21.162Z caller=node_exporter.go:117 level=info collector=thermal_zone
Jun 11 22:17:21 noble prometheus-node-exporter[4013]: ts=2024-06-11T22:17:21.162Z caller=node_exporter.go:117 level=info collector=time
Jun 11 22:17:21 noble prometheus-node-exporter[4013]: ts=2024-06-11T22:17:21.166Z caller=node_exporter.go:117 level=info collector=timex
Jun 11 22:17:21 noble prometheus-node-exporter[4013]: ts=2024-06-11T22:17:21.166Z caller=node_exporter.go:117 level=info collector=udp_queues
Jun 11 22:17:21 noble prometheus-node-exporter[4013]: ts=2024-06-11T22:17:21.166Z caller=node_exporter.go:117 level=info collector=uname
Jun 11 22:17:21 noble prometheus-node-exporter[4013]: ts=2024-06-11T22:17:21.166Z caller=node_exporter.go:117 level=info collector=vmstat
Jun 11 22:17:21 noble prometheus-node-exporter[4013]: ts=2024-06-11T22:17:21.166Z caller=node_exporter.go:117 level=info collector=xfs
Jun 11 22:17:21 noble prometheus-node-exporter[4013]: ts=2024-06-11T22:17:21.166Z caller=node_exporter.go:117 level=info collector=zfs
Jun 11 22:17:21 noble prometheus-node-exporter[4013]: ts=2024-06-11T22:17:21.170Z caller=tls_config.go:274 level=info msg="Listening on" address=[::]:9100
Jun 11 22:17:21 noble prometheus-node-exporter[4013]: ts=2024-06-11T22:17:21.170Z caller=tls_config.go:277 level=info msg="TLS is disabled." http2=false address=[::]:9100
3) Access Prometheus UI
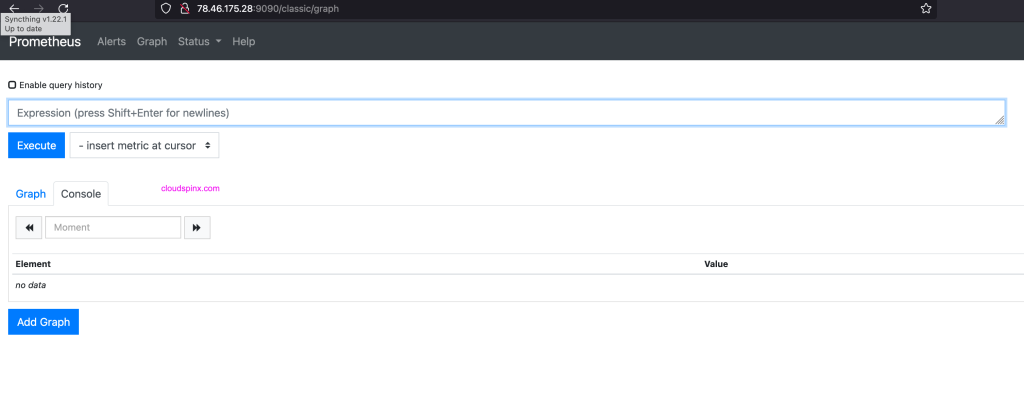
Prometheus server web interface can be accessed from your client host machine at http://(Prometheus server’s hostname or IP address):9090/

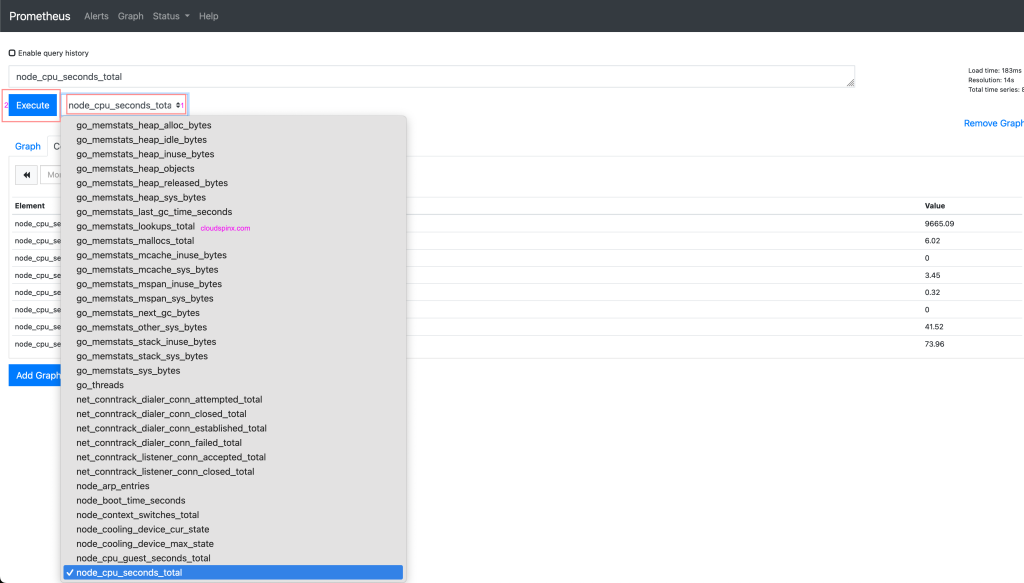
Click on “insert metric at cursor” to select a query from many available queries to view time series data.

It’s possible to input queries directly on the input box above and click “Execute“. From the output you can choose “Graph” to view graphical representation of the metrics data.
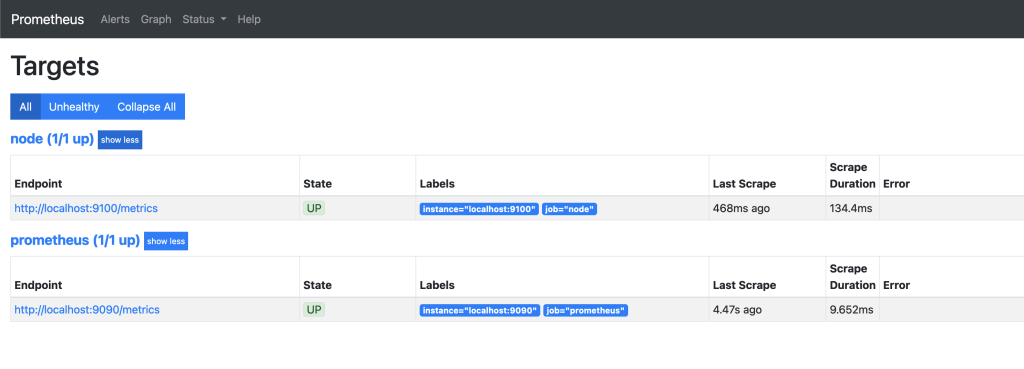
To see all targets added to Grafana, use “Status > Targets“

In the future articles we shall write more content on the usage of Prometheus and all its components. Visit official Prometheus website to learn more.


