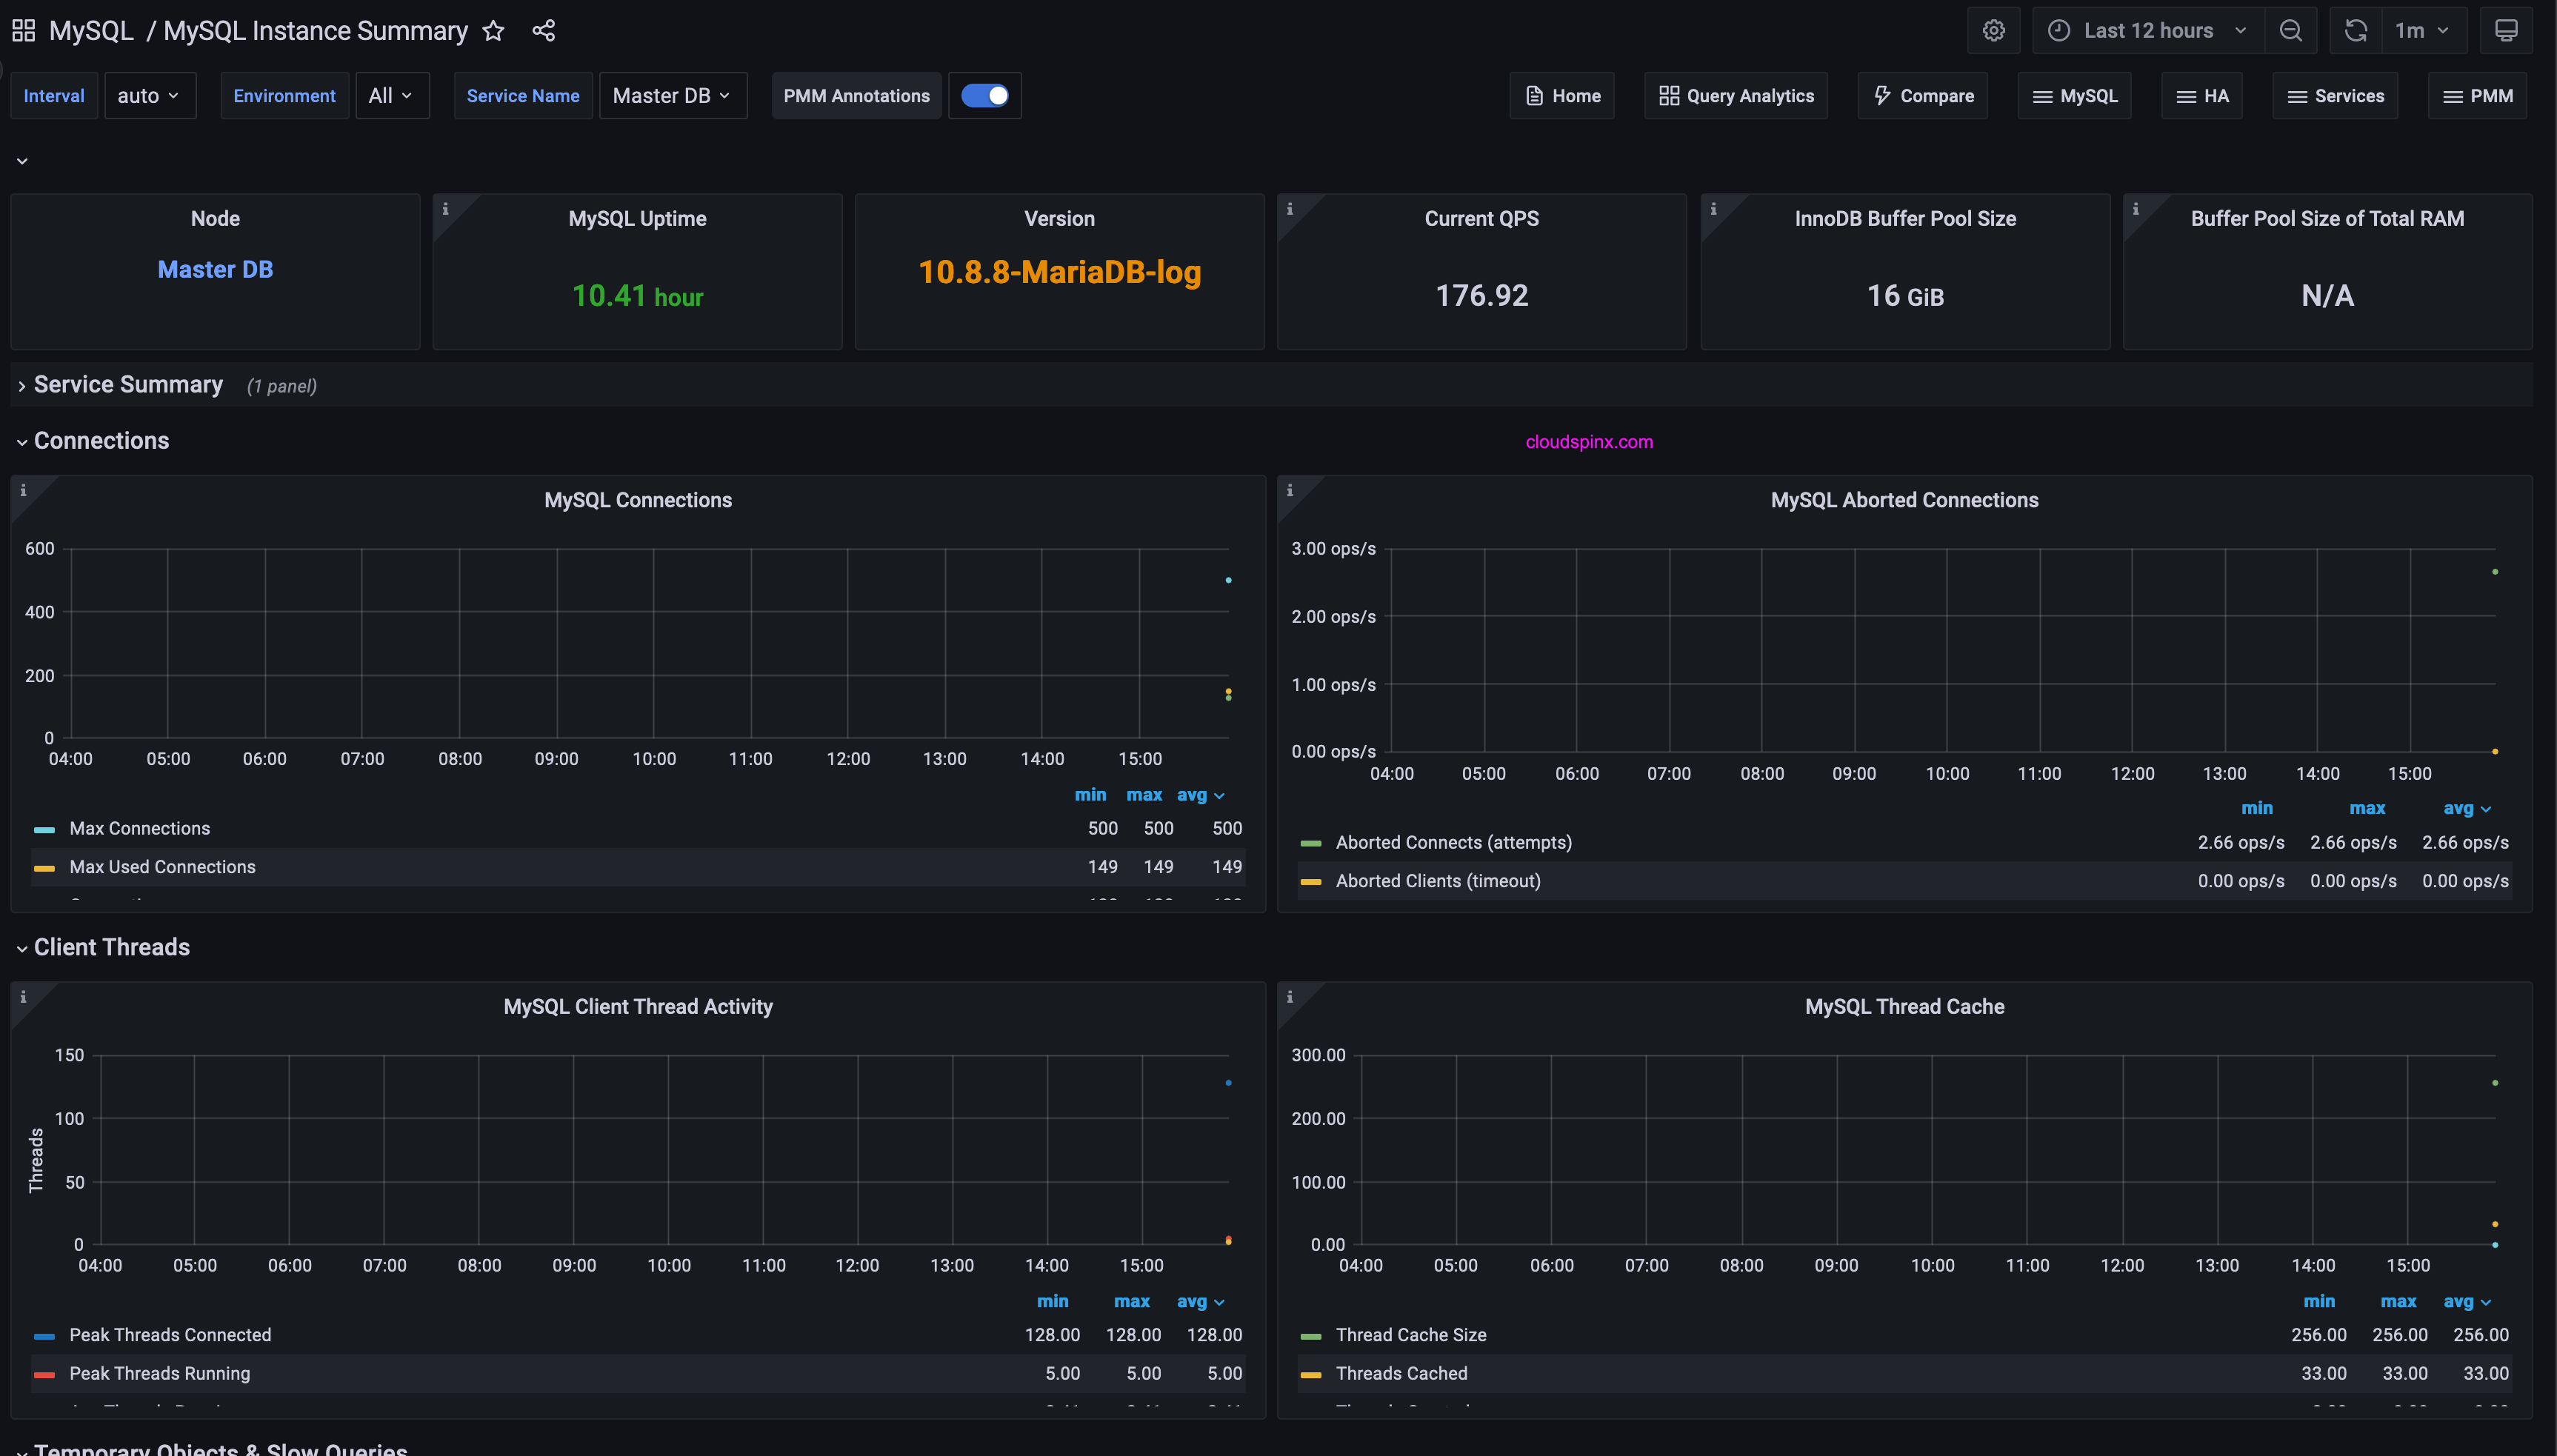
In today’s guide we are going cover in the detail the process of monitoring MariaDB using Prometheus and Grafana. It is critical to monitor your MariaDB database for ensuring its general health and performance is optimal. Prometheus is monitoring software solution that uses pull-based model to scrape metrics from a source such as MariaDB exporter at specified intervals. The data collected is stored in a time-series database which in this article is Prometheus.
We will use Grafana to visualize the metrics and create graphs and dashboards for users to get a friendly interface and analyze various trends, identify anomalies and better insights in how the database server is performing. By continuously collecting the metrics and having visualization for the same, we will be able to capture potential issues before it can impact system users or applications that rely on the service.
Here are the prerequisites for this setup.
- A running instance of MariaDB database server – version >= 10.3
- A running and working Prometheus server installation – it can be on the same or different server
- Installed and configured Grafana server
- A user with sudo privileges
Here are the steps to be followed to have your MariaDB database server monitored using prometheus and grafana.
Step 1 – Install Prometheus
Refer to the articles on our website:
- Rocky / CentOS / AlmaLinux installation guide.
- Installation of Prometheus on Ubuntu Linux and Debian Linux
For any other Linux distribution or OS, refer to Prometheus official documentation pages.
Step 2 – Install Grafana
As stated earlier on in this article, we need Grafana to visualize the metrics collected from MariaDB database server. Refer to our article on the installation of Grafana on Ubuntu Linux.
Step 3 – Prepare MariaDB Server
We will use official Prometheus exporter for MySQL server metrics. This has to be installed in our MariaDB server.
Login to your Database server and download the latest release.
curl -s https://api.github.com/repos/prometheus/mysqld_exporter/releases/latest | grep browser_download_url | grep linux-amd64 | cut -d '"' -f 4 | wget -qi -Extract downloaded file using tar
tar xvf mysqld_exporter*.tar.gzMove the extracted binary to a directory in $PATH
sudo mv  mysqld_exporter-*.linux-amd64/mysqld_exporter /usr/local/bin/
sudo chmod +x /usr/local/bin/mysqld_exporter
Check that it works
$ mysqld_exporter --version
mysqld_exporter, version 0.15.1 (branch: HEAD, revision: cc349684494b5038ec5a52233bdca9eb9291e6f2)
  build user:       root@d89c15b9f5ad
  build date:       20231212-07:55:09
  go version:       go1.21.5
  platform:         linux/amd64
  tags:             unknown
Create Prometheus exporter database user
We need to create database user used by the exporter to get database metrics. The user should have PROCESS, SELECT, REPLICATION CLIENT grants
$ mysql -u root -p
CREATE USER 'mysqld_exporter'@'localhost' IDENTIFIED BY 'StrongDBP@ssw0rD' WITH MAX_USER_CONNECTIONS 2;
GRANT PROCESS, REPLICATION CLIENT, SELECT ON *.* TO 'mysqld_exporter'@'localhost';
FLUSH PRIVILEGES;
EXIT
Step 4: Configure MySQL Exporter
Add Prometheus user and group in MariaDB server.
sudo groupadd --system prometheus
sudo useradd -s /sbin/nologin --system -g prometheus prometheus
Create database credentials file inside /etc directory.
sudo vim /etc/.mysqld_exporter.cnfConfigure correct username and password. This is the user we added to the database with its password.
[client]
user=mysqld_exporter
password=StrongDBP@ssw0rD
Set permissions to prometheus user.
sudo chown root:prometheus /etc/.mysqld_exporter.cnfCreate systemd unit file
sudo vim /etc/systemd/system/mysql_exporter.servicePaste the following contents into the file.
[Unit]
Description=Prometheus MySQL Exporter
After=network.target
User=prometheus
Group=prometheus

[Service]
Type=simple
Restart=always
ExecStart=/usr/local/bin/mysqld_exporter \
--config.my-cnf /etc/.mysqld_exporter.cnf \
--web.listen-address=0.0.0.0:9104

[Install]
WantedBy=multi-user.target
You can as well replace 0.0.0.0 with your system local IP address. For instances in the cloud consider using Basic authentication. Here is the sample web configuration file.
Save the file, reload systemd then start service.
sudo systemctl daemon-reload
sudo system
sudo systemctl enable mysql_exporter
sudo systemctl start mysql_exporter
You can check its status by running:
$ systemctl status mysql_exporter.service
● mysql_exporter.service - Prometheus MySQL Exporter
     Loaded: loaded (/etc/systemd/system/mysql_exporter.service; enabled; preset: disabled)
     Active: active (running) since Fri 2024-06-14 16:31:02 EAT; 6s ago
   Main PID: 99079 (mysqld_exporter)
      Tasks: 5 (limit: 203524)
     Memory: 3.0M
        CPU: 5ms
     CGroup: /system.slice/mysql_exporter.service
             └─99079 /usr/local/bin/mysqld_exporter --config.my-cnf /etc/.mysqld_exporter.cnf --web.listen-address=0.0.0.0:9104

Jun 14 16:31:02 dbmaster01 mysqld_exporter[99079]: ts=2024-06-14T13:31:02.590Z caller=mysqld_exporter.go:220 level=info msg="Starting mysqld_exporter" version="(version=0.15.1, branch=>
Jun 14 16:31:02 dbmaster01 mysqld_exporter[99079]: ts=2024-06-14T13:31:02.590Z caller=mysqld_exporter.go:221 level=info msg="Build context" build_context="(go=go1.21.5, platform=linux/>
Jun 14 16:31:02 dbmaster01 mysqld_exporter[99079]: ts=2024-06-14T13:31:02.590Z caller=mysqld_exporter.go:233 level=info msg="Scraper enabled" scraper=global_variables
Jun 14 16:31:02 dbmaster01 mysqld_exporter[99079]: ts=2024-06-14T13:31:02.590Z caller=mysqld_exporter.go:233 level=info msg="Scraper enabled" scraper=slave_status
Jun 14 16:31:02 dbmaster01 mysqld_exporter[99079]: ts=2024-06-14T13:31:02.590Z caller=mysqld_exporter.go:233 level=info msg="Scraper enabled" scraper=global_status
Jun 14 16:31:02 dbmaster01 mysqld_exporter[99079]: ts=2024-06-14T13:31:02.590Z caller=mysqld_exporter.go:233 level=info msg="Scraper enabled" scraper=info_schema.innodb_cmp
Jun 14 16:31:02 dbmaster01 mysqld_exporter[99079]: ts=2024-06-14T13:31:02.590Z caller=mysqld_exporter.go:233 level=info msg="Scraper enabled" scraper=info_schema.innodb_cmpmem
Jun 14 16:31:02 dbmaster01 mysqld_exporter[99079]: ts=2024-06-14T13:31:02.590Z caller=mysqld_exporter.go:233 level=info msg="Scraper enabled" scraper=info_schema.query_response_time
Jun 14 16:31:02 dbmaster01 mysqld_exporter[99079]: ts=2024-06-14T13:31:02.591Z caller=tls_config.go:274 level=info msg="Listening on" address=[::]:9104
Jun 14 16:31:02 dbmaster01 mysqld_exporter[99079]: ts=2024-06-14T13:31:02.591Z caller=tls_config.go:277 level=info msg="TLS is disabled." http2=false address=[::]:9104
Login to prometheus server and add scraping endpoints.
scrape_configs:
  - job_name: MariadDB01
    static_configs:
      - targets: ['192.168.2.10:9104']
        labels:
          alias: mariadb1

  - job_name: MariadDB02
    static_configs:
      - targets: ['192.168.2.11:9104']
        labels:
          alias: mariadb2
Restart Prometheus server
sudo systemctl restart prometheusStep 5: Configure Grafana
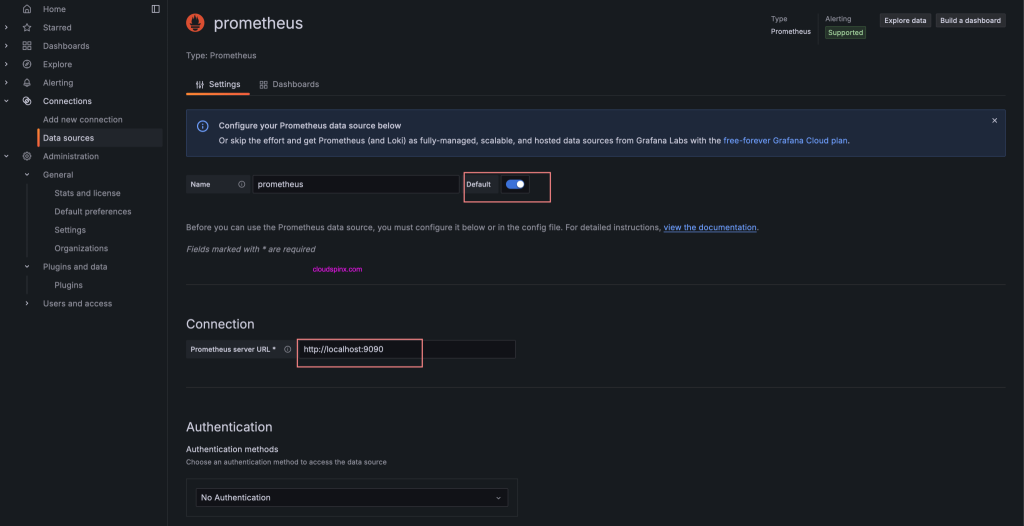
Login to Grafana and configure Prometheus data source if not already done – Configuration > Data Sources.

Input correct URL of your Prometheus server installation and authentication if configured.
Import Grafana dashboards
The Percona team have done an incredible job of creating various dashboards that can be used to visualize MariaDB database server metrics.
A sample dashboard that we can use to test this is Instances Overview.
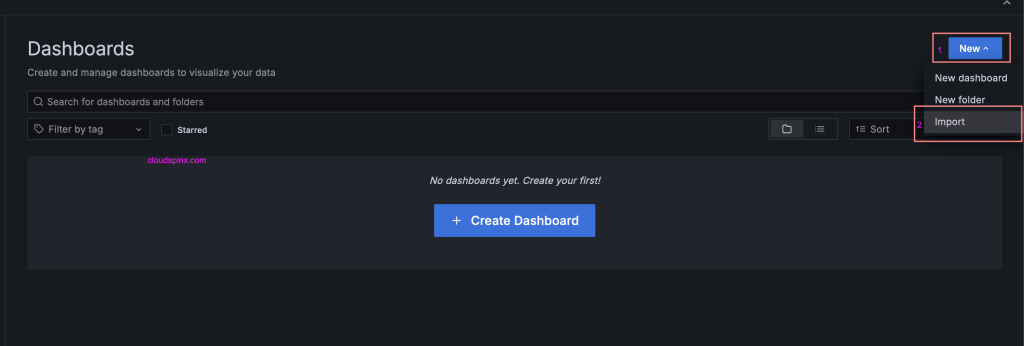
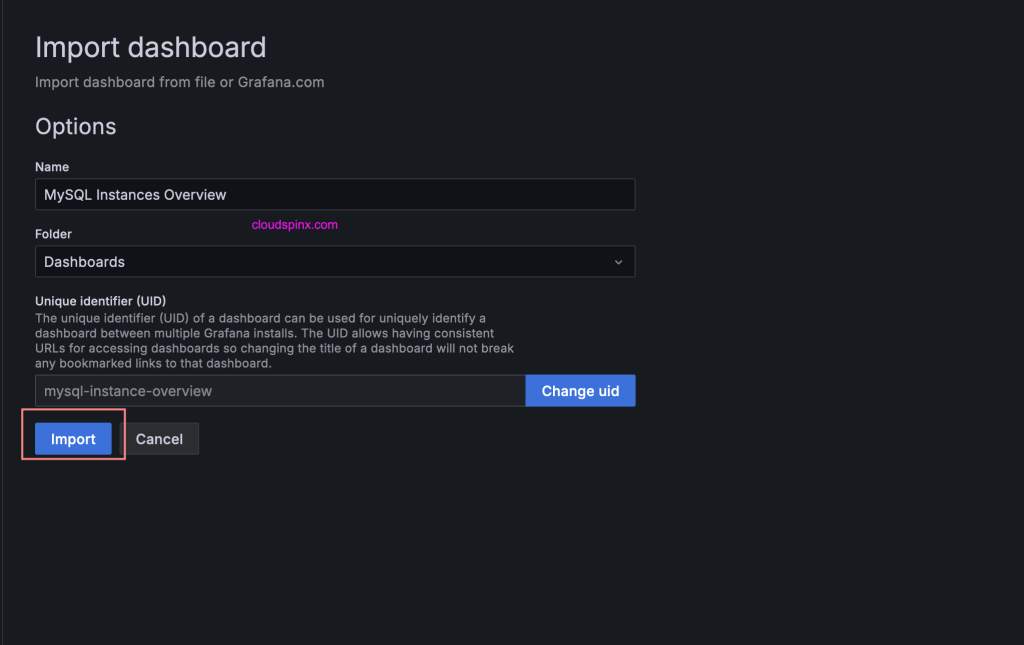
wget https://raw.githubusercontent.com/percona/grafana-dashboards/main/dashboards/MySQL/MySQL_Instances_Overview.jsonImport it by going to Dashboards > New > Import file.
Locate the dashboard JSON file to import.
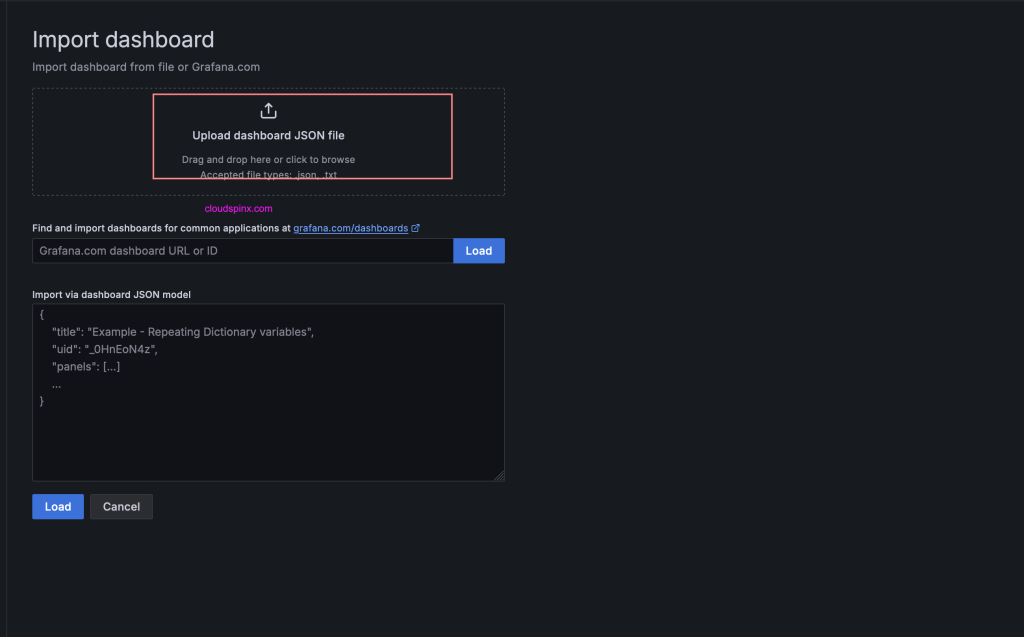
You can adjust Name or use default as defined in the json file.
Give it some minutes and data should start to appear.
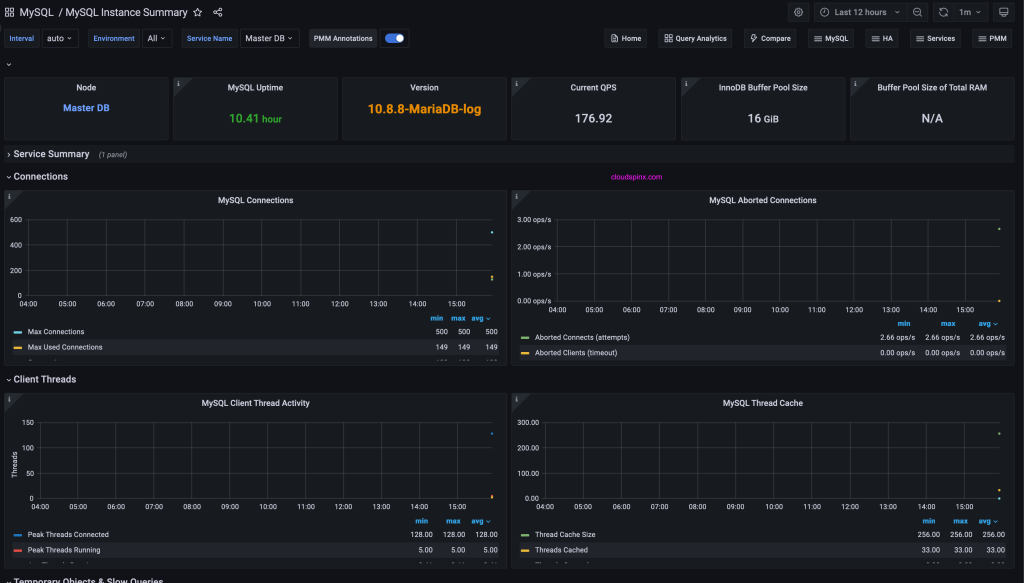
Your database monitoring with Grafana and Prometheus is now complete. You can add more dashboards, customize or create your own to give insights the way you want. Visit Grafana documentation and Prometheus documentation to learn more about the two solutions.

