

Every event that occurs in your Linux system is captured and stored as logs and it allows one to go diagnose the activities happening within the server. Logging is very crucial to system admins, as it helps them to see almost every action performed in the server. In cases of security, logs helps in determining logged-in users and actions performed. All kernel activities are also logged and are helpful in analyzing system performance.
All Linux systems have a dedicated directory for storing system logs, usually /var/log and they use a logging facility called rsyslog, whose configuration file is located in /etc/rsyslog.conf and the system logging service is called rsyslog.service (an improved version of syslog.service, which still runs in some Linux systems). Programs send log entries to rsyslog, which then checks the configuration file for matches and writes logs to the appropriate file in the log directory.
In /var/log directory, you should be able to see various log files from your system. Check the example below:
$ ls -lht /var/log
total 2.5M
-rw-r-----  1 syslog    adm              13K Jun 19 09:05 auth.log
-rw-r-----  1 syslog    adm             376K Jun 19 09:05 syslog
-rw-rw-r--  1 root      utmp            286K Jun 19 08:59 lastlog
-rw-rw-r--  1 root      utmp             29K Jun 19 08:59 wtmp
-rw-r-----  1 root      adm              71K Jun 19 08:56 dmesg
-rw-r-----  1 syslog    adm             189K Jun 19 08:55 kern.log
-rw-r--r--  1 root      root            151K Jun 19 08:54 dpkg.log
-rw-r--r--  1 root      root            8.9K Jun 19 08:53 alternatives.log
-rw-r-----  1 root      adm              75K Jun 19 08:52 dmesg.0
drwxr-xr-x  2 root      root            4.0K Jun 19 08:51 apt
-rw-r-----  1 root      adm              19K Jun 19 08:15 dmesg.1.gz
drwxr-x---  2 root      adm             4.0K Jun 19 08:15 unattended-upgrades
-rw-r-----  1 syslog    adm             388K Jun 19 08:15 syslog.1
-rw-rw----  1 root      utmp               0 Jun 19 08:15 btmp
drwxr-xr-x  2 root      root            4.0K Jun 19 08:15 sysstat
-rw-r-----  1 syslog    adm             195K Jan 23 12:11 kern.log.1
-rw-r-----  1 syslog    adm              16K Jan 23 12:10 auth.log.1
-rw-r-----  1 root      adm              18K Jan 23 12:07 dmesg.2.gz
-rw-r--r--  1 root      root            695K Jan 20 05:02 dpkg.log.1
-rw-rw----  1 root      utmp             384 Jan 20 04:56 btmp.1
-rw-r-----  1 root      adm              18K Jan 20 04:55 dmesg.3.gz
-rw-r-----  1 syslog    adm              83K Jan 20 04:55 cloud-init.log
-rw-r-----  1 root      adm             4.5K Jan 20 04:55 cloud-init-output.log
-rw-r-----  1 root      adm                0 Jan 20 04:55 apport.log
drwxr-sr-x+ 3 root      systemd-journal 4.0K Jan 20 04:54 journal
drwxrwx---  4 root      adm             4.0K Jan 20 04:54 installer
-rw-r--r--  1 root      root             34K Jan 20 04:54 alternatives.log.1
drwxr-xr-x  2 landscape landscape       4.0K Aug 27  2024 landscape
lrwxrwxrwx  1 root      root              39 Aug 27  2024 README -> ../../usr/share/doc/systemd/README.logs
drwx------  2 root      root            4.0K Aug 27  2024 private
-rw-r--r--  1 root      root             60K Aug 27  2024 bootstrap.log
-rw-r--r--  1 root      root               0 Aug 27  2024 faillog
drwxr-xr-x  2 root      root            4.0K Aug 21  2024 dist-upgrade
The most important log files are as discussed below:
/var/log/syslogand/var/log/messages– stores all global system activity including startup messages. Debian-based systems use/var/log/syslogwhile Red Hat usevar/log/messages./var/log/auth.logand/var/log/secure– Keeps security-related activities such as root user actions, logins and output from pluggable authentication modules (PAM). Debian-based systems use/var/log/auth.logwhile Red Hat use/var/log/secure./var/log/kern.log– keeps all kernel events, errors and warning logs, useful in troubleshooting custom kernels./var/log/apacheand/var/log/nginx– If you are running a webserver with Apache2 and Nginx respively, logs are stored in these directories.
Analyzing Linux Web Server Logs with GoAccess
It is not just enough to know where logs are located. The importance of logs is to help system admins understand what is happening on a Linux system and troubleshoot where needed. They should therefore to able to view and analyze the logs are draw useful information. In this guide we are going to study a tool called GoAccess that is very helpful in analyzing system logs.
What is GoAccess and Why use it?
GoAccess is an open source web log analyzer. It is real time and provides an interactive viewer on the terminal. It quickly analyzes and provides valuable HTTP statistics.
It was designed to be a fast terminal-based analyzer whose main idea is to rapidly and in real time view and analyze web statistics without having to use your browser. Apart from the terminal output, GoAccess has the ability to generate complete, self-contained, real-time log reports in html, json and csv.
Features of GoAccess
Some of the most interesting features of GoAccess include:
- Completely real-time – All metrics are updated every 200ms on the terminal output and every 1s on html output.
- It requires very minimal configuration. You can run it against your access log, letting GoAccess parse access log and output stats.
- It tracks application response time which is quite useful if identifying pages slowing down your site.
- Supports nearly all web log formats – It allows any custom log format string and the preferred ones include apache, nginx, Amazon S3, Elastic Load Balancing and CloudFront among others.
- Incremental log processing – GoAccess is capable of processing logs incrementally using on-disk persistance option.
- One dependency – GoAccess is written in C and it requires only ncurses installed.
- Metrics per Virtual Host – If you have more than one Virtual Host, GoAccess displays which host is consuming most web server resources.
- Color Scheme Customizable – You can tailor GoAccess to your favorite themes, either on the terminal or applying a stylesheet to HTML.
- Supports large datasets – It has the ability to parse large logs. It has good memory usage and good performance. Storage supports on-disk persistence.
- GoAccess supports Docker containers through the use of volume mapping and editing of GoAccess configuration file.
- GoAccess enables you to determine the amount of hits, visitors, bandwidth, and metrics for slowest running requests by the hour, or date.
GoAccess Supported Log Formats.
GoAccess supports nearly all web log formats, allowing any custom log format string. Some of the predefined options include:
- Amazon CloudFront (Download Distribution).
- Amazon Simple Storage Service (S3)
- AWS Elastic Load Balancing
- Combined Log Format (XLF/ELF) Apache | Nginx
- Common Log Format (CLF) Apache
- Google Cloud Storage.
- Apache virtual hosts
- Squid Native Format.
- W3C format (IIS).
Installing GoAccess on Linux and MacOS
You can easily install GoAccess using package manager for various Linux distributions as below. There are two installation methods you can use:
Install GoAccess from OS system repos
For the installation using package manager refer to valid sections for your system below:
# Ubuntu/ Debian
sudo apt-get install goaccess

# or add an official GoAccess repository on Ubuntu/ Debian to ensure that you install the latest version.
$ wget -O - https://deb.goaccess.io/gnugpg.key | gpg --dearmor | sudo tee /usr/share/keyrings/goaccess.gpg >/dev/null
$ echo "deb [signed-by=/usr/share/keyrings/goaccess.gpg arch=$(dpkg --print-architecture)] https://deb.goaccess.io/ $(lsb_release -cs) main" | sudo tee /etc/apt/sources.list.d/goaccess.list
$ sudo apt-get update
$ sudo apt-get install goaccess

# On Fedora
sudo yum install goaccess

# on Arch Linux
sudo pacman -S goaccess

# on OS X / Homebrew
brew install goaccess

# FreeBSD
sudo pkg install sysutils/goaccess

# OpenBSD
sudo pkg_add goaccess

# OpenSUSE
sudo zypper ar -f obs://server:http http
sudo zypper in goaccess

# pkgsrc (NetBSD, Solaris, SmartOS, ...)
sudo pkgin install goaccess
Install GoAccess by building from source
First install requires dependencies:
#On Ubuntu/ Debian
sudo apt update
sudo apt install build-essential libncursesw5-dev libglib2.0-dev libgeoip-dev libtokyocabinet-dev

#On CentOS Stream
sudo yum install gcc cmake ncurses-devel

#On Fedora / RHEL based systems
sudo dnf install gcc cmake ncurses-devel

#On macOS
brew install ncurses
Or build GoAccess from release. Download, extract and compile GoAccess as below:
wget https://tar.goaccess.io/goaccess-1.9.4.tar.gz
tar -xzvf goaccess-1.9.4.tar.gz
cd goaccess-1.9.4/
./configure --enable-utf8 --enable-geoip=mmdb
make
make install
Using GoAccess Web Log Analyzer
In my demo, I have a simple site running on Apache2 on Ubuntu 24.04.
GoAccess configuration file is found in /etc/goaccess/goaccess.conf. Open it with your preferred editor and configure date and log formats as you need.
Configure it as follows:
# of the Apache's log formats below.
#
date-format %d/%b/%Y
#
# NCSA Combined Log Format
#
log-format %h %^[%d:%^] "%r" %s %b "%R" "%u"
#
# NCSA Combined Log Format with Virtual Host
#
log-format %^:%^ %h %^[%d:%^] "%r" %s %b "%R" "%u"
#
I want to output access log from apache log directory with GoAccess. Change to Apache log directory
cd /var/log/apache2Run the command below:
goaccess /var/log/apache2/access.logOutput is a real-time log view and analyzer:
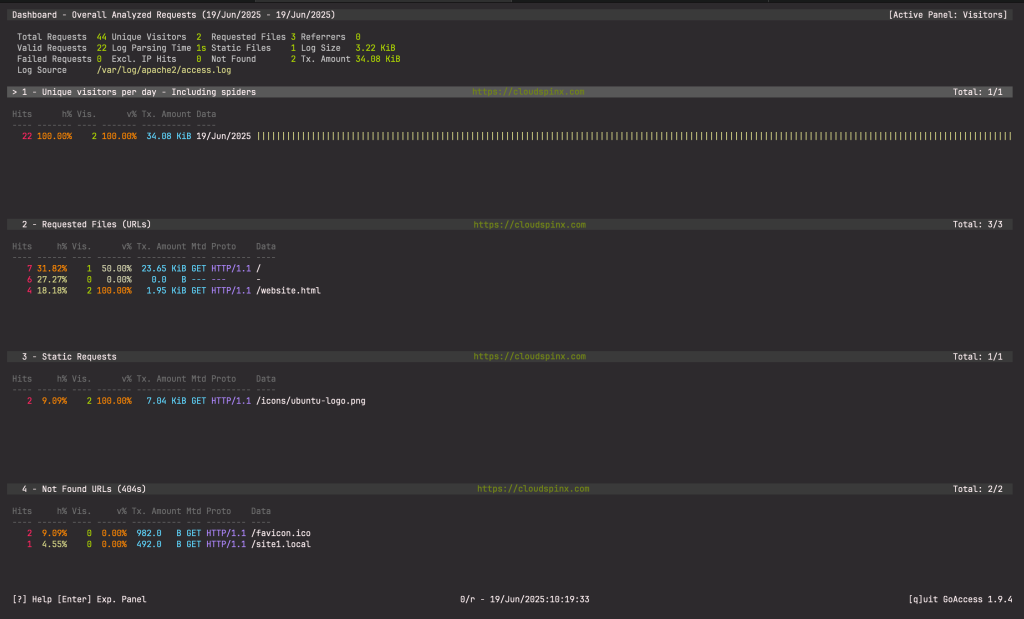
GoAccess Reports
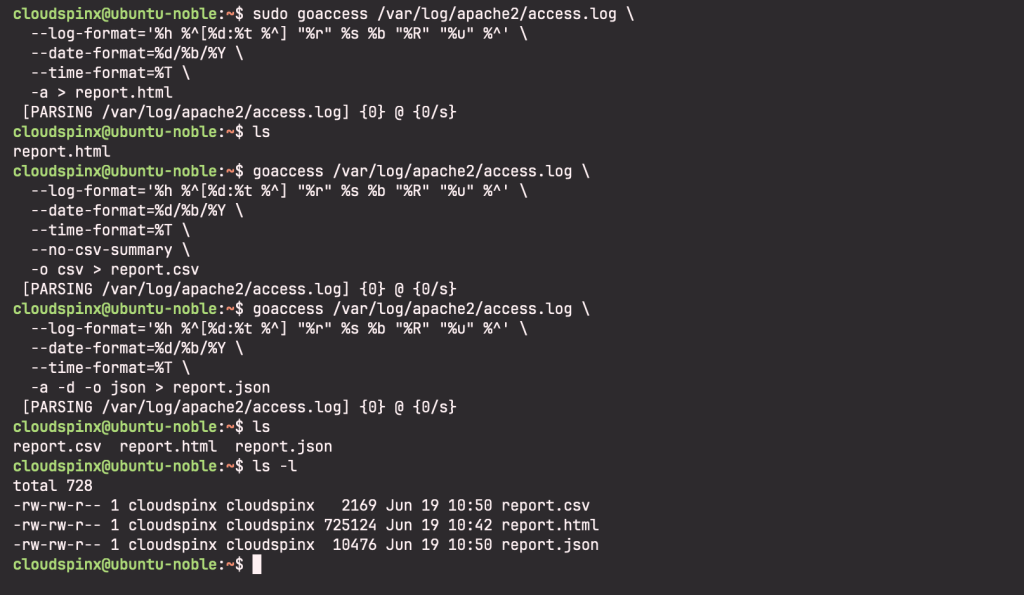
To get various report formats, run the commands below for html, json and csv:
$ cd
$ sudo goaccess /var/log/apache2/access.log \
  --log-format='%h %^[%d:%t %^] "%r" %s %b "%R" "%u" %^' \
  --date-format=%d/%b/%Y \
  --time-format=%T \
  -a > report.html

$ goaccess /var/log/apache2/access.log \
  --log-format='%h %^[%d:%t %^] "%r" %s %b "%R" "%u" %^' \
  --date-format=%d/%b/%Y \
  --time-format=%T \
  --no-csv-summary \
  -o csv > report.csv

$ goaccess /var/log/apache2/access.log \
  --log-format='%h %^[%d:%t %^] "%r" %s %b "%R" "%u" %^' \
  --date-format=%d/%b/%Y \
  --time-format=%T \
  -a -d -o json > report.json
You notice that I am parsing a custom time format because sometimes GoAccess throws incompatible time format errors. Confirm the reports are created in the directory you are working from:
You can also you can easily monitor logs for quick outputs using ‘tail -f’ as below
tail -f /var/log/apache2/access.log | \
goaccess --log-format='%h %^[%d:%t %^] "%r" %s %b "%R" "%u" %^' \
  --date-format=%d/%b/%Y \
  --time-format=%T -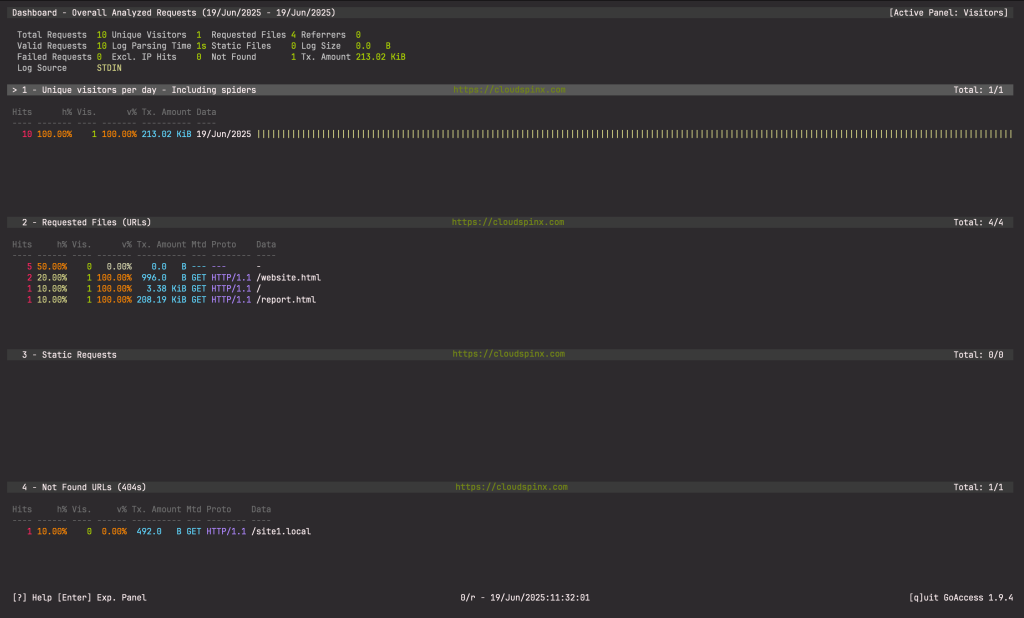
And you can filter output with ‘grep’ command:
tail -f /var/log/apache2/access.log | \
  grep -i --line-buffered 'firefox' | \
  goaccess --log-format=COMBINED \
  - Output
GoAccess Multiple Files
You can parse multiple files as below:
goaccess access.log access.log.1
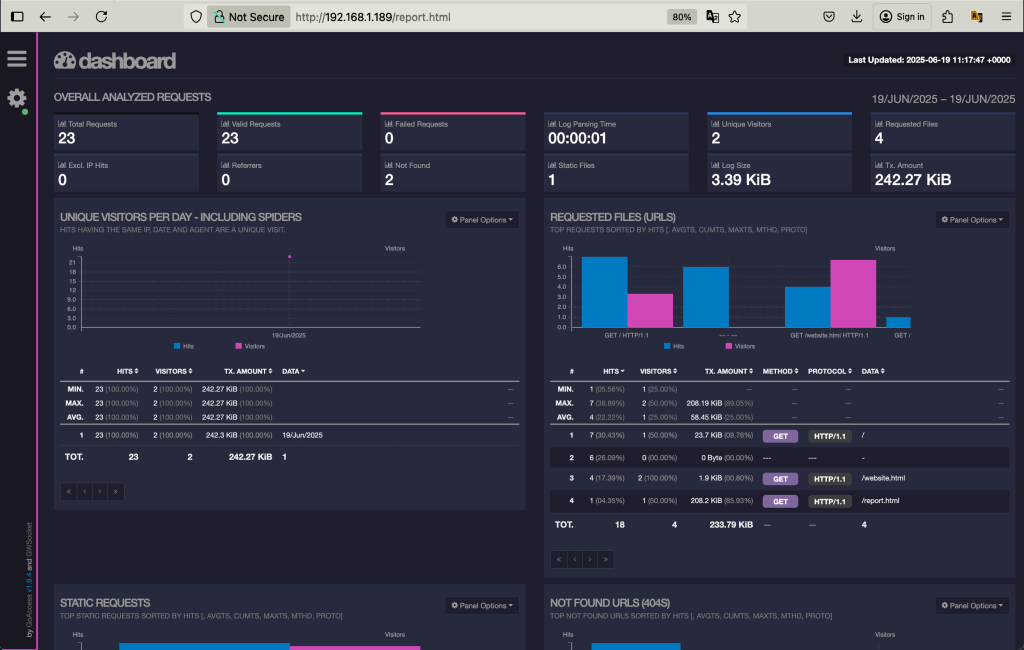
cat access.log.2 | goaccess access.log access.log.1 -Real-time HTML Outputs
GoAccess can output real-time data in the HTML report.
$ sudo goaccess /var/log/apache2/access.log \
  --log-format='%h %^[%d:%t %^] "%r" %s %b "%R" "%u" %^' \
  --date-format=%d/%b/%Y \
  --time-format=%T \
  -o /var/www/html/report.html \
  --real-time-html
To view this report, navigate to http://your_site/report.html.
GoAccess listens on port 7890 by default. You can parse a different port and ensure that you have opened the port on server firewall
$ sudo goaccess /var/log/apache2/access.log \
  --log-format='%h %^[%d:%t %^] "%r" %s %b "%R" "%u" %^' \
  --date-format=%d/%b/%Y \
  --time-format=%T \
  -o /var/www/html/report.html \
  --real-time-html \
  --port=<new_port>
GoAccess Filtering
You would want to filter dates out of the webserver log. Use the commands below:
sed -n '/29\/Nov\/2020/,$ p' access.log | \
  goaccess --log-format='%h %^[%d:%t %^] "%r" %s %b "%R" "%u" %^' \
  --date-format=%d/%b/%Y \
  --time-format=%T -a -
Or parse a specific time frame
sed -n '/5\/Nov\/2010/,/5\/Dec\/2010/ p' access.log | \
  goaccess --log-format='%h %^[%d:%t %^] "%r" %s %b "%R" "%u" %^' \
  --date-format=%d/%b/%Y \
  --time-format=%T -a -
GoAccess Files, status codes and bots
o parse specific pages, e.g., page views, html, htm, php, etc. within a request
awk '$7~/\.html|\.htm|\.php/' access.log | \
  goaccess --log-format='%h %^[%d:%t %^] "%r" %s %b "%R" "%u" %^' \
  --date-format=%d/%b/%Y \
  --time-format=%T -a -
Or to parse a specific status code, e.g., 500 (Internal Server Error):
awk '$9~/500/' access.log | \
  goaccess --log-format='%h %^[%d:%t %^] "%r" %s %b "%R" "%u" %^' \
  --date-format=%d/%b/%Y \
  --time-format=%T -
GoAccess is a powerful web log analyzer and there is quite a lot that you can do with it. I hope this guide on how to use GoAccess to view and analyze Linux Web Server logs has been informative enough to get you working with GoAccess. Have fun! Below are more useful and interesting guides for you